. 2017 Jan;214(1):91-106.
doi: 10.1084/jem.20160849. Epub 2016 Dec 23.

Combined immunodeficiency and Epstein-Barr virus-induced B cell malignancy in humans with inherited CD70 deficiency

Affiliations

Combined immunodeficiency and Epstein-Barr virus-induced B cell malignancy in humans with inherited CD70 deficiency

Hassan Abolhassani et al. J Exp Med. 2017 Jan.

Abstract

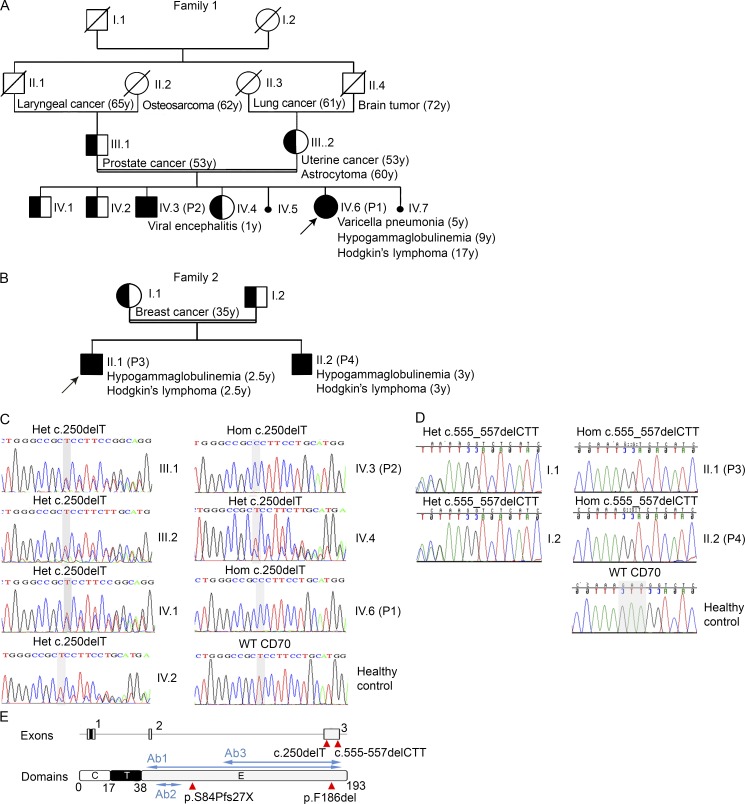
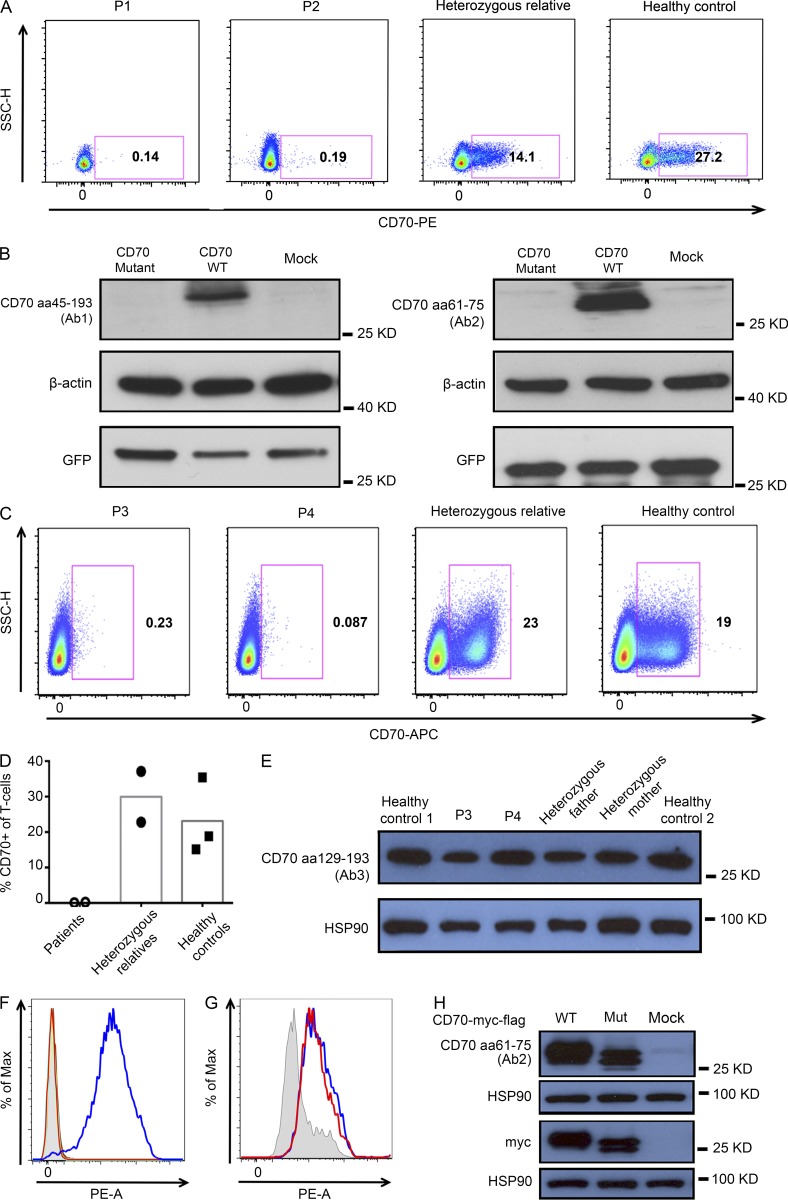
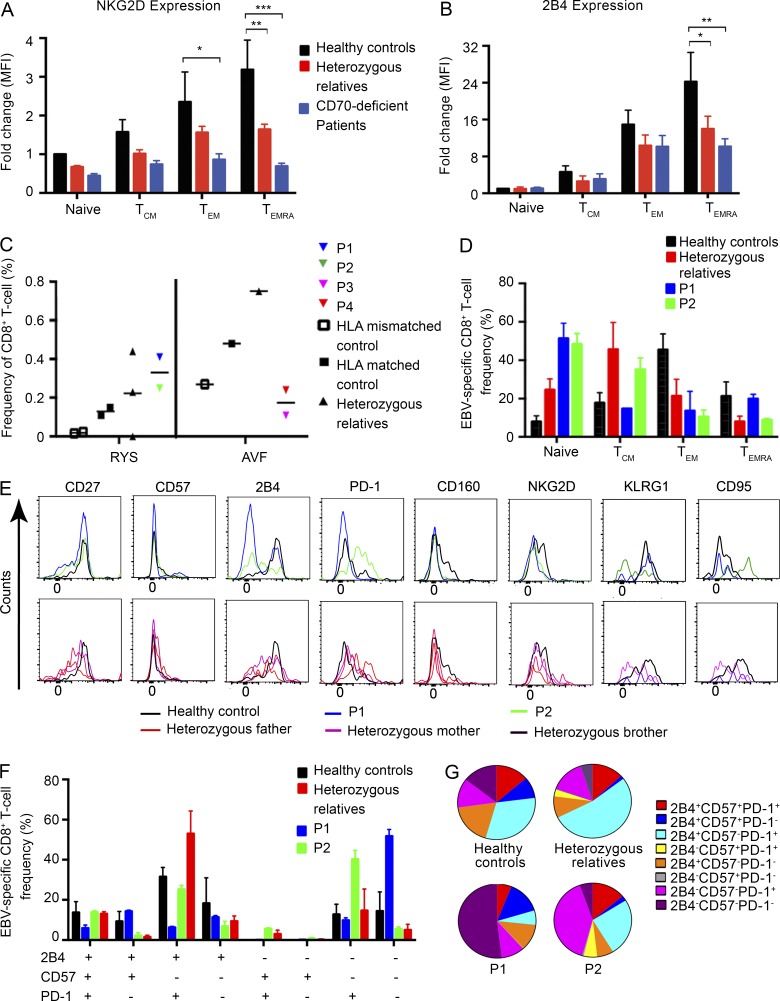
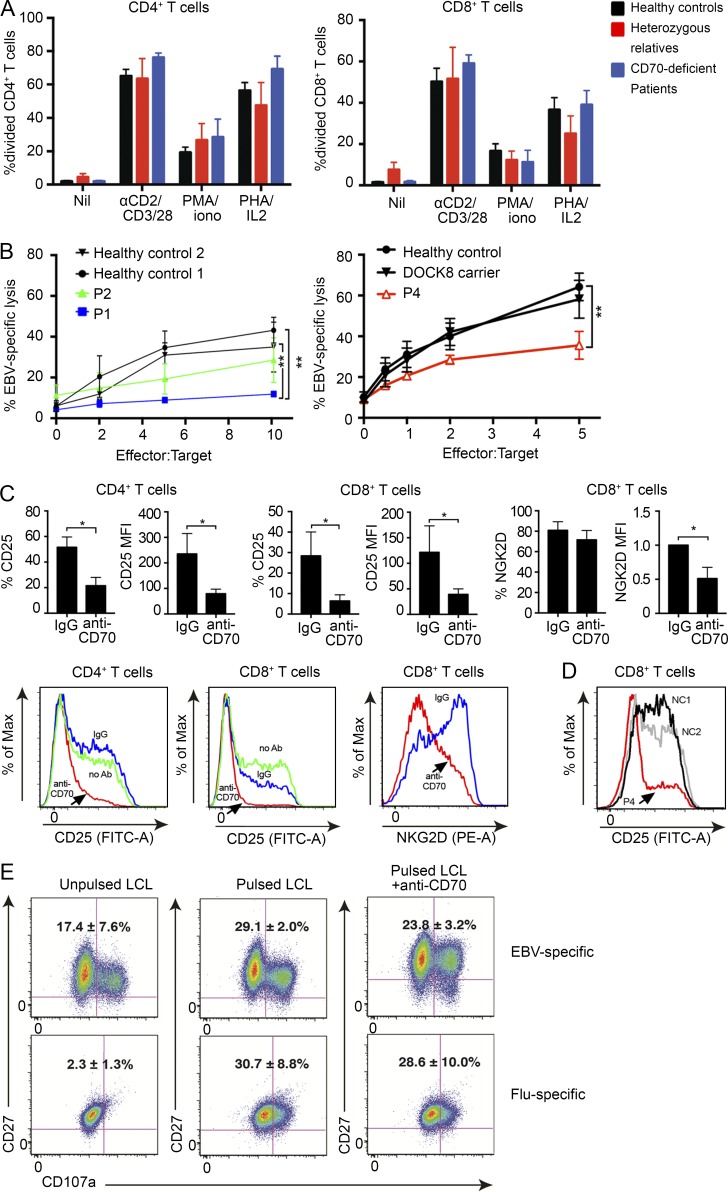
In this study, we describe four patients from two unrelated families of different ethnicities with a primary immunodeficiency, predominantly manifesting as susceptibility to Epstein-Barr virus (EBV)-related diseases. Three patients presented with EBV-associated Hodgkin's lymphoma and hypogammaglobulinemia; one also had severe varicella infection. The fourth had viral encephalitis during infancy. Homozygous frameshift or in-frame deletions in CD70 in these patients abolished either CD70 surface expression or binding to its cognate receptor CD27. Blood lymphocyte numbers were normal, but the proportions of memory B cells and EBV-specific effector memory CD8+ T cells were reduced. Furthermore, although T cell proliferation was normal, in vitro-generated EBV-specific cytotoxic T cell activity was reduced because of CD70 deficiency. This reflected impaired activation by, rather than effects during killing of, EBV-transformed B cells. Notably, expression of 2B4 and NKG2D, receptors implicated in controlling EBV infection, on memory CD8+ T cells from CD70-deficient individuals was reduced, consistent with their impaired killing of EBV-infected cells. Thus, autosomal recessive CD70 deficiency is a novel cause of combined immunodeficiency and EBV-associated diseases, reminiscent of inherited CD27 deficiency. Overall, human CD70-CD27 interactions therefore play a nonredundant role in T and B cell-mediated immunity, especially for protection against EBV and humoral immunity.


Figures

Figure 1.
Figure 1.
Identification of CD70 mutations in two families with immunodeficiency and malignancy. (A) Family 1 pedigree. Cancer type, age of cancer diagnosis, and other key clinical manifestations in family members as well as the proband are shown. (B) Family 2 pedigree. Key clinical manifestations are shown. (A and B) /, deceased; double line, consanguinity; arrow, the proband (IV.6 in family 1 and II.1 in family 2); half-shaded, heterozygous; shaded, homozygous; unshaded, unknown; IV.5 and IV.7, miscarried fetus. (C) Sanger sequencing analysis of the CD70 gene in family 1. A homozygous (Hom) mutation was confirmed in the proband (P1) and the affected sibling (P2; IV.3). Heterozygous (Het) mutations were identified in the parents and three healthy siblings. (D) Sanger sequencing analysis of the CD70 gene in family 2. A homozygous mutation was confirmed in the proband (P3) and the affected sibling (P4). Heterozygous mutations were identified in the parents. Gray shading on the WT sequence indicates the bases that are deleted in the familial mutation. The sequences in this figure are in reverse direction. (C and D) The Sanger sequencing presented has been confirmed in at least two independent experiments. (E) The location of the mutation identified in the families in relation to the exon and protein domains (red triangles). The locations of antibodies (Ab1 recognizing amino acids 45–193, Ab2 recognizing amino acids 61–75, and Ab3 recognizing amino acids 129–193) used to detect CD70 protein expression are marked by blue arrows. C, cytoplasmic; E, extracellular; T, transmembrane.
Figure 2.
Figure 2.
Expression analysis of the CD70 mutants. (A) Expression of CD70 by peripheral blood B cells from the CD70-deficient patients (P1 and P2), compared with a heterozygous relative (father) and a normal control. CD70 expression was analyzed on CD19+-gated, live, single B cells. (B) Immunoblotting analysis of CD70 WT and mutant (identified in family 1) transfected HEK 293 cells. CD70 expression was probed with two different Abs specific for different epitopes (Ab1 and Ab2). GFP expression confirmed successful transfection, and β-actin served as a loading control. (C–E) Expression of CD70 by activated peripheral blood T cells from the two homozygous CD70-mutant patients (P3 and P4), compared with heterozygous parents (n = 2) and normal controls (n = 3). CD70 expression was analyzed by flow cytometry on CD3+ gated, live, single T cells using a mAb raised against CD70-transfected L cells (C and D) or by immunoblotting using polyclonal Abs (Ab3) raised against an extended C-terminal portion of CD70 (E). HSP90 was used to assess protein loading. (F) Binding of overexpressed WT or mutant CD70 to recombinant human CD27 was evaluated by flow cytometry. Shaded areas represent nontransfected 293T cells. Binding of anti-CD5 mAbs to cells transfected with WT (turquoise) or mutant (yellow) CD70 is shown. Binding of biotinylated CD27/streptavidin-PE in cells transfected with WT (blue) or mutant (red) CD70 is shown. (G) Flow cytometric detection of the flag epitope on cells transfected with WT (blue) or mutant (red) CD70 or on untransfected cells (shaded). (H) Immunoblotting of lysates from untransfected cells or cells transfected with WT or mutant CD70 plasmid, using Abs to CD70 (Ab2), myc tag, or HSP90. All data are representative of at least two independent experiments. Mut, mutant; SSC, side scatter.
Figure 3.
Figure 3.
Phenotype of EBV-specific CD8+ T cells in CD70-deficient individuals. (A and B) PBMCs from healthy donors (n = 5), heterozygous carriers (n = 5), and CD70-deficient patients (n = 4) were labeled with mAbs against CD3, CD8, CD45RA, CCR7, NKG2D, and 2B4. Naive (CD45RA+CCR7+), TCM (CD45RACCR7+), TEM (CD45RACCR7), and TEMRA (CD45RA+CCR7) CD8+ T cells were identified, and then, expression of NKG2D (A) and 2B4 (B) on each subset was determined. Data are expressed as fold-change in mean fluorescence intensity (MFI; mean ± SEM) relative to expression on naive CD8+ T cells from healthy donors (normalized to 1). The statistics were performed by two-way ANOVA. *, P < 0.05; **, P < 0.01; ***, P < 0.001. (C) Frequency of EBV-specific CD8+ T cells based on staining with the HLA-A*2402–RYSIFFDY (RYS) or HLA-A*1101–AVFDRKSDAK (AVF) tetramer in CD70-deficient individuals (n = 4), heterozygous family members (n = 4), and HLA-matched (n = 3) and -mismatched (n = 3) controls. (D) Total frequency of EBV tetramer+ CD8+ T cells (HLA-A*2402–RYS) in naive, TCM, TEM, and TEMRA CD8+ T cell populations in P1 and P2, heterozygous family members (n = 3), and HLA-matched controls (n = 3). Error bars represent mean ± SEM, and experiments for each patient were done on two separate occasions. (E) Expression of CD57, 2B4, PD-1, CD27, CD160, NKG2D, KLRG1, and CD95 on EBV-specific CD8+ T cells from P1 and P2, heterozygous family members (n = 3), and healthy controls (n = 2). (F and G) Overlays and SPICE chart of coexpression of regulatory markers of CD57, 2B4, and PD-1 in tetramer+ CD8+ T cells. (F) Error bars represent mean ± SEM, and experiments for each patient were done on two separate occasions. All data are representative of two individual experiments.
Figure 4.
Figure 4.
Impaired cytotoxicity of CD70-deficient CD8+ T cells against EBV–B cell targets. (A) PBMCs from healthy donors (n = 11), heterozygous relatives (n = 3), and CD70-deficient patients (n = 4) were labeled with CFSE and then cultured in vitro in the absence (Nil) or presence of anti-CD2, CD3, CD28 beads, PMA/ionomycin (iono), or PHA/IL-2. Proliferation was determined after 4–5 d by determining the percentage of CD4+ or CD8+ T cells that had undergone one or more divisions. Values represent the mean ± SEM. (B) Percent lysis of autologous EBV-LCLs by EBV-specific CTL from P1 and P2 (compared with two healthy controls) and P4 (compared with a healthy control and a DOCK8+/− carrier). Shown are means ± SD from two (for P1 and P2) and four (for P4) experiments, respectively. **, P < 0.005 by one-way ANOVA. (C) Cell-surface activation marker expression on T cells, induced by EBV-LCLs in the presence of 10 µg/ml anti-CD70 or isotype control. Percent positive or geometric mean fluorescence intensity (MFI) of gated CD4+ T cells or CD8+ T cells, with CD25 measured at 4 d and NKG2D at 5 d of stimulation is shown. NKG2D mean fluorescence intensity was normalized to that of corresponding isotype control samples. Shown are representative histograms and means ± SD from treatments of PBMCs from four different healthy control donors without prior in vitro stimulation. *, P < 0.05 by a Mann-Whitney U test. (D) CD25 induction on T cells from two healthy controls or P4, after 4 d of stimulation by EBV-LCLs. Shown are representative histograms of gated CD8+ T cells during the fourth cycle of stimulation with irradiated autologous EBV-LCLs; similar results were obtained during the second or third cycles of stimulation. (E) EBV- or Flu-specific CD8+ T cell clones from healthy donors were cultured with autologous EBV-LCLs with or without specific peptides in the absence or presence of 10 µg/ml blocking anti-CD70 mAb. Expression of CD107a by the T cell clones was determined after 6 h. The values represent the mean ± SEM of two or three experiments using EBV-specific or Flu-specific clones, respectively. Note the increased level of activation of EBV-specific CD8+ T cell clones in the presence of unpulsed LCLs, over that observed for flu-specific clones, reflects the recognition of peptides by EBV-specific clones presented endogenously (i.e., without pulsing) by the autologous LCLs.

Similar articles

Cited by

References

    1. Abolhassani H., Wang N., Aghamohammadi A., Rezaei N., Lee Y.N., Frugoni F., Notarangelo L.D., Pan-Hammarström Q., and Hammarström L.. 2014. A hypomorphic recombination-activating gene 1 (RAG1) mutation resulting in a phenotype resembling common variable immunodeficiency. J. Allergy Clin. Immunol. 134:1375–1380. 10.1016/j.jaci.2014.04.042 - DOI - PMC - PubMed
    1. Agematsu K., Kobata T., Yang F.C., Nakazawa T., Fukushima K., Kitahara M., Mori T., Sugita K., Morimoto C., and Komiyama A.. 1995. CD27/CD70 interaction directly drives B cell IgG and IgM synthesis. Eur. J. Immunol. 25:2825–2829. 10.1002/eji.1830251017 - DOI - PubMed
    1. Agematsu K., Nagumo H., Oguchi Y., Nakazawa T., Fukushima K., Yasui K., Ito S., Kobata T., Morimoto C., and Komiyama A.. 1998. Generation of plasma cells from peripheral blood memory B cells: synergistic effect of interleukin-10 and CD27/CD70 interaction. Blood. 91:173–180. - PubMed
    1. Agematsu K., Hokibara S., Nagumo H., Shinozaki K., Yamada S., and Komiyama A.. 1999. Plasma cell generation from B-lymphocytes via CD27/CD70 interaction. Leuk. Lymphoma. 35:219–225. 10.3109/10428199909145724 - DOI - PubMed
    1. Aguilar C., and Latour S.. 2015. X-linked inhibitor of apoptosis protein deficiency: more than an X-linked lymphoproliferative syndrome. J. Clin. Immunol. 35:331–338. 10.1007/s10875-015-0141-9 - DOI - PubMed

Publication types

Substances