. 2017 Feb 1;49(2):96-104.
doi: 10.1152/physiolgenomics.00081.2016. Epub 2016 Dec 23.

Alterations in the gut microbiota can elicit hypertension in rats

Affiliations

Alterations in the gut microbiota can elicit hypertension in rats

Sareema Adnan et al. Physiol Genomics. .

Abstract

Gut dysbiosis has been linked to cardiovascular diseases including hypertension. We tested the hypothesis that hypertension could be induced in a normotensive strain of rats or attenuated in a hypertensive strain of rats by exchanging the gut microbiota between the two strains. Cecal contents from spontaneously hypertensive stroke prone rats (SHRSP) were pooled. Similarly, cecal contents from normotensive WKY rats were pooled. Four-week-old recipient WKY and SHR rats, previously treated with antibiotics to reduce the native microbiota, were gavaged with WKY or SHRSP microbiota, resulting in four groups; WKY with WKY microbiota (WKY g-WKY), WKY with SHRSP microbiota (WKY g-SHRSP), SHR with SHRSP microbiota (SHR g-SHRSP), and SHR with WKY microbiota (SHR g-WKY). Systolic blood pressure (SBP) was measured weekly using tail-cuff plethysmography. At 11.5 wk of age systolic blood pressure increased 26 mmHg in WKY g-SHRSP compared with that in WKY g-WKY (182 ± 8 vs. 156 ± 8 mmHg, P = 0.02). Although the SBP in SHR g-WKY tended to decrease compared with SHR g-SHRSP, the differences were not statistically significant. Fecal pellets were collected at 11.5 wk of age for identification of the microbiota by sequencing the 16S ribosomal RNA gene. We observed a significant increase in the Firmicutes:Bacteroidetes ratio in the hypertensive WKY g-SHRSP, as compared with the normotensive WKY g-WKY (P = 0.042). Relative abundance of multiple taxa correlated with SBP. We conclude that gut dysbiosis can directly affect SBP. Manipulation of the gut microbiota may represent an innovative treatment for hypertension.

Keywords: dysbiosis; hypertension; microbiota; short chain fatty acids; spontaneously hypertensive rat.


Figures

Fig. 1.
Fig. 1.
Systolic blood pressure (SBP) of Wistar-Kyoto (WKY) and spontaneously hypertensive rats (SHR) gavaged with PBS by age. Data are shown as means ± SE, n = 6–7, *P = 0.006 for WKY vs. SHR.
Fig. 2.
Fig. 2.
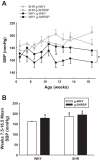
Stroke-prone spontaneously hypertensive rat (SHRSP) microbiota increases SBP in WKY rats. A: SBP of 4 microbiota gavage treatment groups over time. Three-way repeated measures ANOVA, P < 0.001 for main effects of strain, gavage, and age. Two-way repeated measures ANOVA, *P = 0.028 for main effect of gavage, #P < 0.05 for WKY g-WKY vs. WKY g-SHRSP. B: mean SBP from 7.5 to 16.5 wk (all time points during microbiota gavage treatments). Two-way repeated measures ANOVA, $P < 0.05 relative to WKY g-WKY. Data are shown as means ± SE, n = 6–7.
Fig. 3.
Fig. 3.
Measures of alpha- and beta-diversity vary by strain and microbiota gavage treatments. A: strain and gavage treatment did not affect the microbial community richness (Chao1 index). B: SHRSP microbiota increases the microbial community diversity (Shannon index) of WKY rats. C: principal coordinate analysis of WKY and SHRs gavaged with WKY or SHRSP cecal contents. Unifrac analysis was used to generate distance measurements between each sample. Two clusters were formed corresponding to the gavaged microbiota. Also shown is the 3-dimensional localization of the WKY and SHRSP cecal content used for gavages. Dashed line denotes separation between WKY g-WKY and SHR g-WKY. Data are shown as means ± SE n = 6–7, *P < 0.05 for WKY g-WKY vs. WKY g-SHRSP.
Fig. 4.
Fig. 4.
Comparison of phyla between WKY and SHR strains receiving WKY or SHRSP gavage treatments. A: relative abundance of the major phyla of the gut microbiota. B: increased Firmicutes:Bacteroidetes ratio in WKY g-SHRSP, as compared with WKY g-WKY, is due to expansion of Firmicutes as well as contraction of Bacteroidetes. Data are shown as means ± SE n = 6–7, *P < 0.05 for WKY g-WKY vs. WKY g-SHRSP.
Fig. 5.
Fig. 5.
Gavage treatments alter the relative abundance of multiple bacterial taxa. Linear discriminate analysis effect size (LEFSe) analysis was used to calculate a linear discriminate analysis (LDA) score for taxa that characterize WKY vs. SHRSP gavage treatment of WKY rats (A), WKY vs. SHRSP gavage treatment of SHR rats (B). Positive LDA scores indicate the enrichment of taxa in g-WKY (green) relative to g-SHRSP (red), and negative LDA scores indicate the depletion of taxa in g-WKY relative to g-SHRSP. Given this relationship, the negative LDA scores can also be interpreted as enrichment in g-SHRSP (red) relative to g-WKY (green). C: taxa found to be significantly different by LEFSe analysis (from A and B) are shown in cladograms to illustrate the phylogenetic relationship between altered taxa. Nodes labeled alpha-numerically in C correspond to the labels in parenthesis in A and B. D: relative abundance of the genus Desulfovibrio in WKY and SHRs gavaged with WKY or SHRSP microbiota. *P < 0.05 relative to WKY g-WKY, n = 6–7.
Fig. 6.
Fig. 6.
Shifts in taxon abundance that correlate with SBP. A: the lactate-producing genus Lactobacillus positively correlates with SBP. B–D: the butyrate-producing family Clostrideaceae and acetate-producing genera Holdemania and Coprobacillus negatively correlate with SBP. Data are shown as means ± SE n = 6–7.
Fig. 7.
Fig. 7.
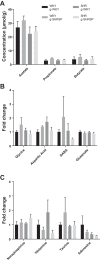
Assessment of fecal metabolites by targeted metabolomics. A: short chain fatty acid concentrations. B and C: selected neurotransmitters and amino acids were not significantly different between WKY and SHRs gavaged with WKY or SHRSP microbiota. Data are shown as means ± SE n = 6–7.

References

    1. Babidge W, Millard S, Roediger W. Sulfides impair short chain fatty acid beta-oxidation at acyl-CoA dehydrogenase level in colonocytes: implications for ulcerative colitis. Mol Cell Biochem 181: 117–124, 1998. doi: 10.1023/A:1006838231432. - DOI - PubMed
    1. Berni Canani R, Di Costanzo M, Leone L. The epigenetic effects of butyrate: potential therapeutic implications for clinical practice. Clin Epigenetics 4: 4, 2012. doi: 10.1186/1868-7083-4-4. - DOI - PMC - PubMed
    1. Blumberg R, Powrie F. Microbiota, disease, and back to health: a metastable journey. Sci Transl Med 4: 137rv7, 2012. doi: 10.1126/scitranslmed.3004184. - DOI - PMC - PubMed
    1. Brown JM, Hazen SL. Metaorganismal nutrient metabolism as a basis of cardiovascular disease. Curr Opin Lipidol 25: 48–53, 2014. doi: 10.1097/MOL.0000000000000036. - DOI - PMC - PubMed
    1. Campbell JM, Fahey GC Jr, Wolf BW. Selected indigestible oligosaccharides affect large bowel mass, cecal and fecal short-chain fatty acids, pH and microflora in rats. J Nutr 127: 130–136, 1997. - PubMed

Publication types

LinkOut - more resources