

MHC class II alleles associated with Th1 rather than Th17 type immunity drive the onset of early arthritis in a rat model of rheumatoid arthritis
- PMID: 28012172
- PMCID: PMC7163699
- DOI: 10.1002/eji.201646760
MHC class II alleles associated with Th1 rather than Th17 type immunity drive the onset of early arthritis in a rat model of rheumatoid arthritis
Abstract
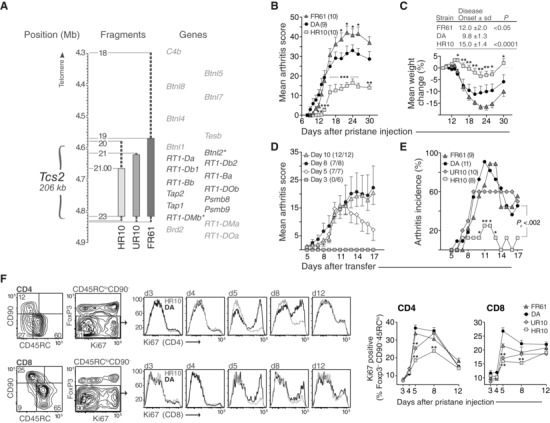
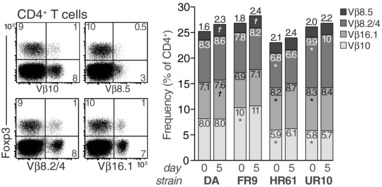
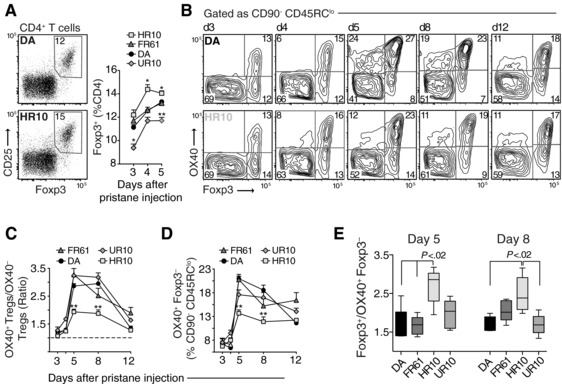
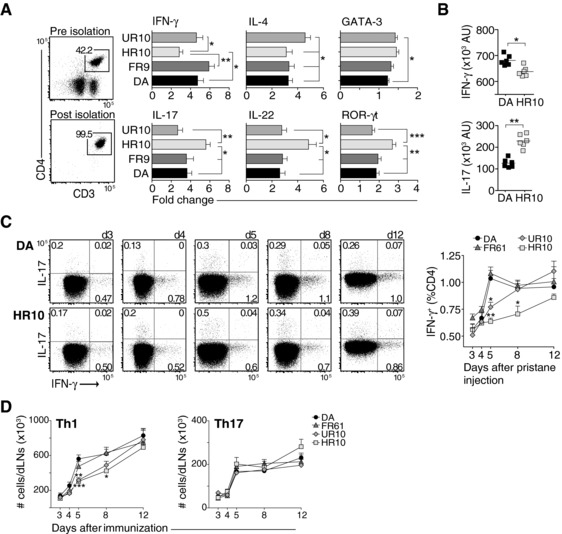
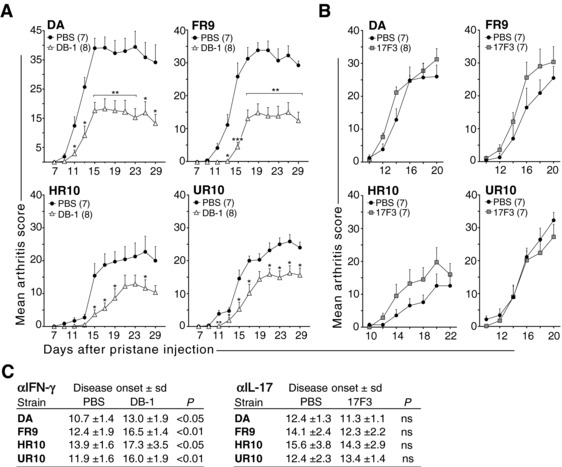
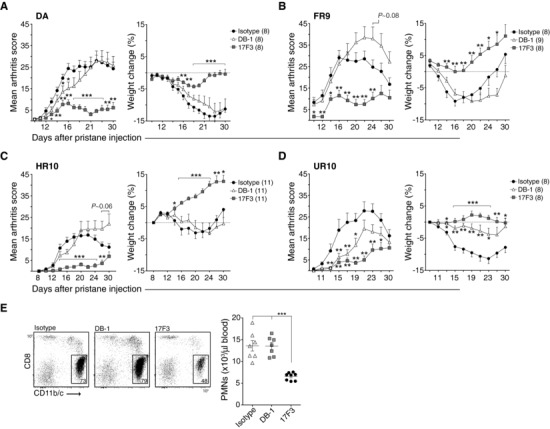
Polymorphisms in the MHC class II (MHCII) genes are strongly associated with rheumatoid arthritis, supporting the importance of autoreactive T helper (Th) cells for the development of this disease. Here, we used pristane-induced arthritis (PIA), induced by the non-antigenic hydrocarbon pristane, to study the impact of different MHCII alleles on T-cell activation and differentiation. In MHCII-congenic rats with disease-promoting MHCII alleles, pristane primarily induced activation of Th1 cells, whereas activated T cells were Th17 biased in rats with protective MHCII alleles. Neutralization of IFN-γ during T-cell activation abrogated the development of disease, suggesting that Th1 immunity is important for disease induction. Neutralization of IL-17, by contrast, suppressed arthritis only when performed in rats with established disease. Adoptive T-cell transfers showed that T cells acquired arthritogenic capacity earlier in strains with a prevailing Th1 response. Moreover, upon pristane injection, these strains exhibited more Ag-primed OX40+ and proliferating T cells of polyclonal origin. These data show that T cells are polarized upon the first encounter with peptide-MHCII complexes in an allele-dependent fashion. In PIA, the polyclonal expansion of autoreactive Th1 cells was necessary for the onset of arthritis, while IL-17 mediated immunity contributed to the progression to chronic disease.
Keywords: Animal models; Autoimmunity; Immune responses; MHC; Rheumatoid arthritis; T helper (Th) cells.
© 2016 WILEY-VCH Verlag GmbH & Co. KGaA, Weinheim.
Conflict of interest statement
The authors have no conflict of interest to declare.
Figures
Similar articles
-
Pristane, a non-antigenic adjuvant, induces MHC class II-restricted, arthritogenic T cells in the rat.J Immunol. 2006 Jan 15;176(2):1172-9. doi: 10.4049/jimmunol.176.2.1172. J Immunol. 2006. PMID: 16394006
-
Positional identification of RT1-B (HLA-DQ) as susceptibility locus for autoimmune arthritis.J Immunol. 2015 Mar 15;194(6):2539-50. doi: 10.4049/jimmunol.1402238. Epub 2015 Feb 11. J Immunol. 2015. PMID: 25672758
-
Location of CD4+ T cell priming regulates the differentiation of Th1 and Th17 cells and their contribution to arthritis.J Immunol. 2013 Jun 1;190(11):5423-35. doi: 10.4049/jimmunol.1203045. Epub 2013 Apr 29. J Immunol. 2013. PMID: 23630349 Free PMC article.
-
Understanding the Regulatory Roles of Natural Killer T Cells in Rheumatoid Arthritis: T Helper Cell Differentiation Dependent or Independent?Scand J Immunol. 2016 Oct;84(4):197-203. doi: 10.1111/sji.12460. Scand J Immunol. 2016. PMID: 27384545 Review.
-
A cellular and molecular view of T helper 17 cell plasticity in autoimmunity.J Autoimmun. 2018 Feb;87:1-15. doi: 10.1016/j.jaut.2017.12.007. Epub 2017 Dec 22. J Autoimmun. 2018. PMID: 29275836 Review.
Cited by
-
Influence of hydrocarbon oil structure on adjuvanticity and autoimmunity.Sci Rep. 2017 Nov 8;7(1):14998. doi: 10.1038/s41598-017-15096-z. Sci Rep. 2017. PMID: 29118363 Free PMC article.
-
Th Cell Phenotypes and Their Correlations with Disease Activity in Patients with Rheumatoid Arthritis.J Clin Med. 2025 Jun 13;14(12):4220. doi: 10.3390/jcm14124220. J Clin Med. 2025. PMID: 40565964 Free PMC article.
-
Stromal cells from perinatal and adult sources modulate the inflammatory immune response in vitro by decreasing Th1 cell proliferation and cytokine secretion.Stem Cells Transl Med. 2020 Jan;9(1):61-73. doi: 10.1002/sctm.19-0123. Epub 2019 Oct 22. Stem Cells Transl Med. 2020. PMID: 31638323 Free PMC article.
-
Mechanisms of Tripterygium wilfordii Hook F on treating rheumatoid arthritis explored by network pharmacology analysis and molecular docking.Open Med (Wars). 2024 May 30;19(1):20240967. doi: 10.1515/med-2024-0967. eCollection 2024. Open Med (Wars). 2024. PMID: 38841174 Free PMC article.
-
Therapy targeting antigen-specific T cells by a peptide-based tolerizing vaccine against autoimmune arthritis.Proc Natl Acad Sci U S A. 2023 Jun 20;120(25):e2218668120. doi: 10.1073/pnas.2218668120. Epub 2023 Jun 12. Proc Natl Acad Sci U S A. 2023. PMID: 37307481 Free PMC article.
References
-
- Mahdi, H. , Fisher, B. A. , Källberg, H. , Plant, D. , Malmström, V. , Rönnelid, J. , Charles, P. et al., Specific interaction between genotype, smoking and autoimmunity to citrullinated alpha‐enolase in the etiology of rheumatoid arthritis. Nat. Genet. 2009. 41: 1319–1324. doi: 10.1038/ng.480. - DOI - PubMed
Publication types
MeSH terms
Substances
LinkOut - more resources
Full Text Sources
Other Literature Sources
Medical
Research Materials
