. 2017 Apr:11:219-230.
doi: 10.1016/j.redox.2016.12.015. Epub 2016 Dec 18.

Autophagy deficient keratinocytes display increased DNA damage, senescence and aberrant lipid composition after oxidative stress in vitro and in vivo

Affiliations

Autophagy deficient keratinocytes display increased DNA damage, senescence and aberrant lipid composition after oxidative stress in vitro and in vivo

Xiuzu Song et al. Redox Biol. 2017 Apr.

Abstract

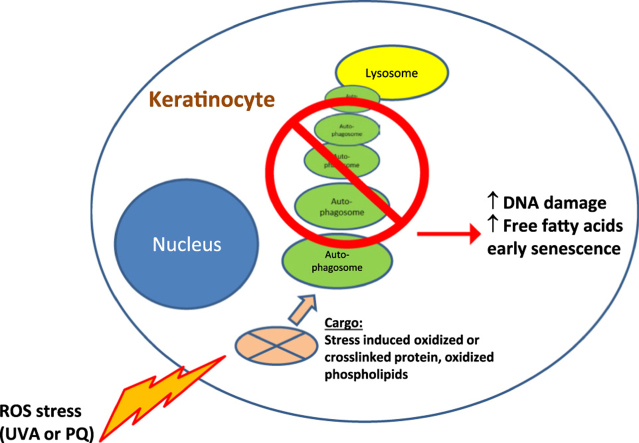
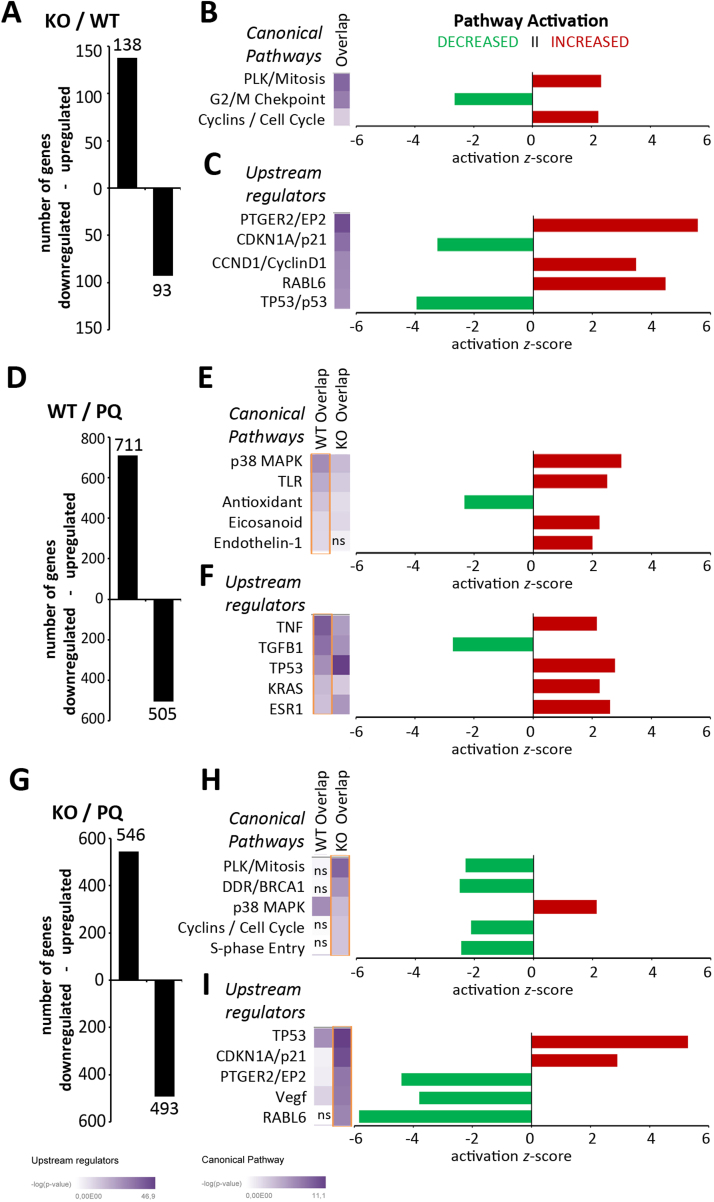
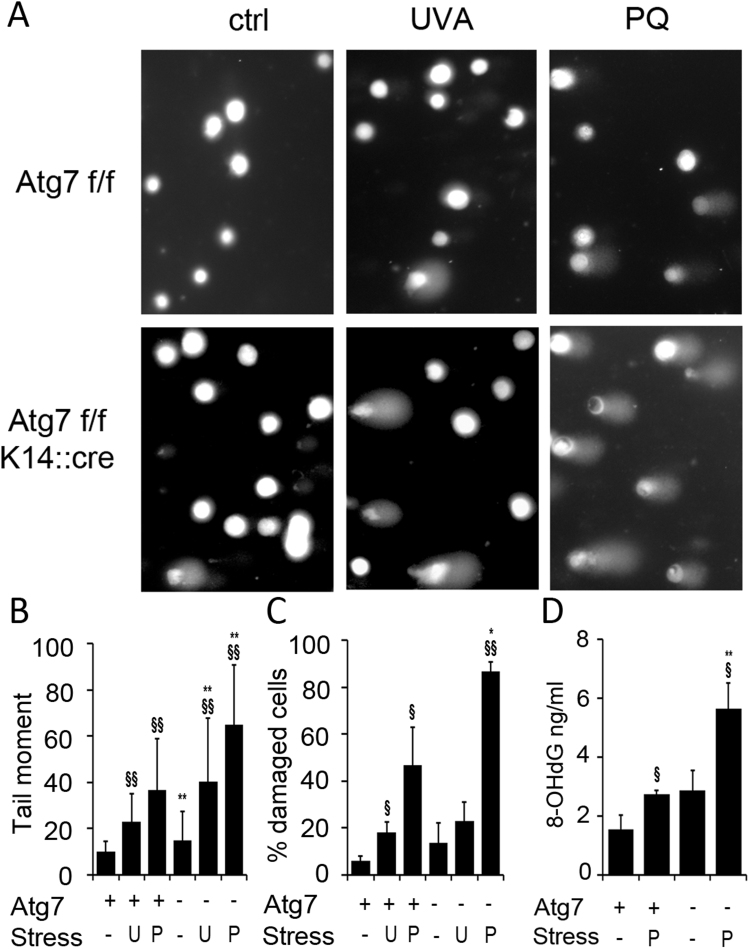
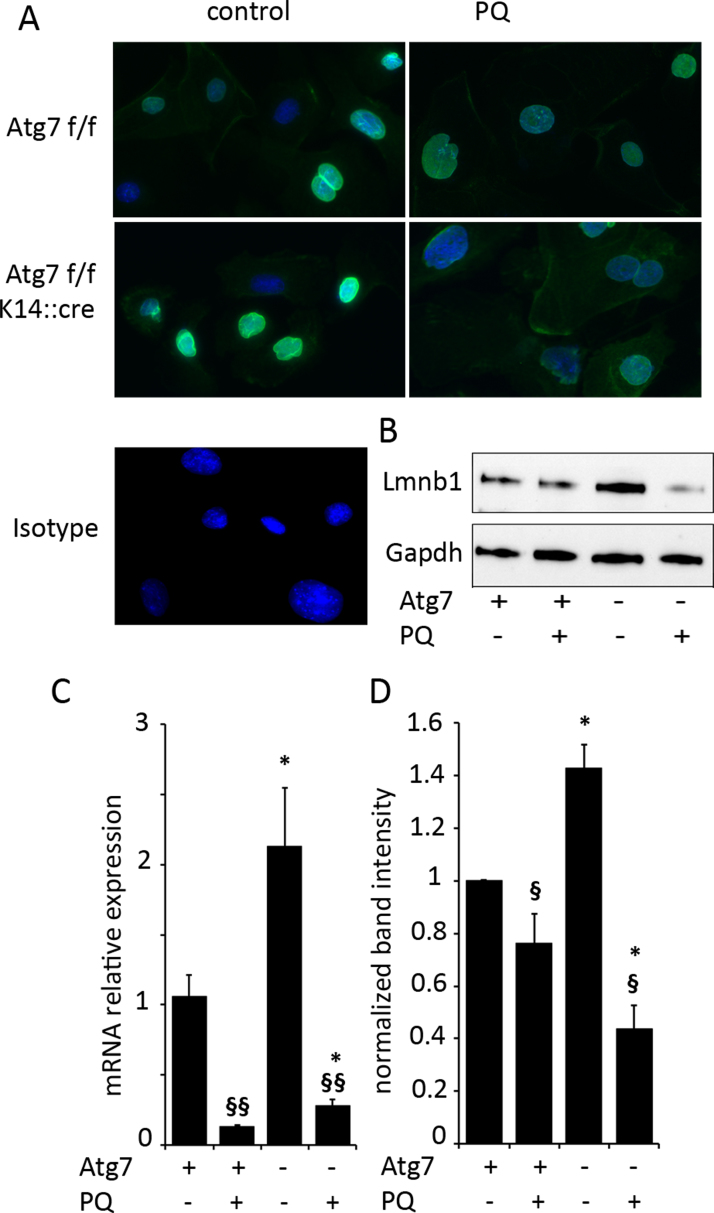
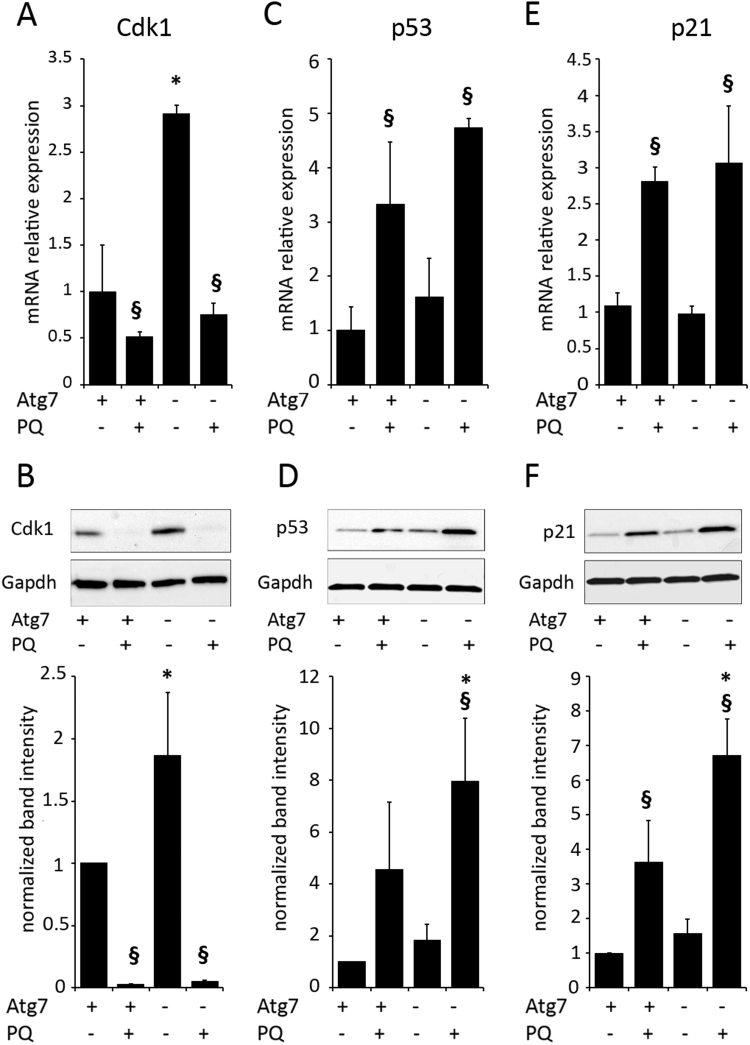
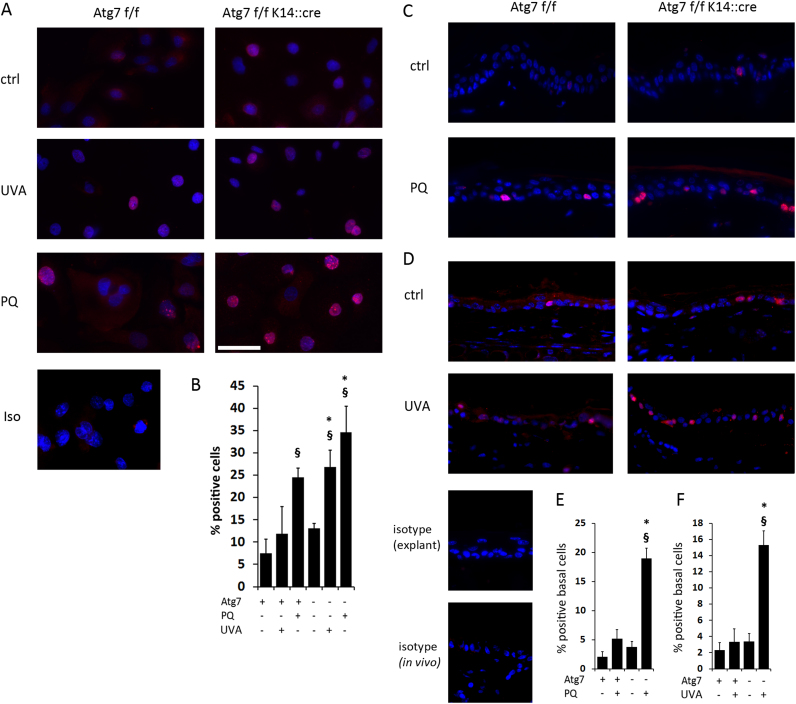
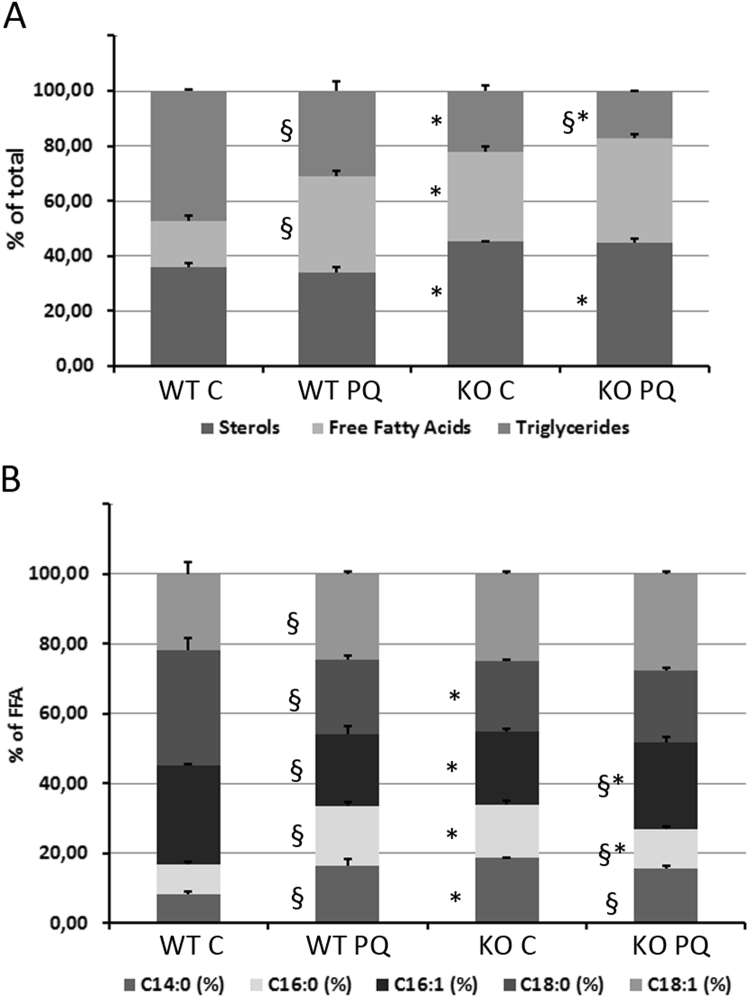
Autophagy allows cells fundamental adaptations to metabolic needs and to stress. Using autophagic bulk degradation cells can clear crosslinked macromolecules and damaged organelles that arise under redox stress. Accumulation of such debris results in cellular dysfunction and is observed in aged tissue and senescent cells. Conversely, promising anti-aging strategies aim at inhibiting the mTOR pathway and thereby activating autophagy, to counteract aging associated damage. We have inactivated autophagy related 7 (Atg7), an essential autophagy gene, in murine keratinocytes (KC) and have found in an earlier study that this resulted in increased baseline oxidative stress and reduced capacity to degrade crosslinked proteins after oxidative ultraviolet stress. To investigate whether autophagy deficiency would promote cellular aging, we studied how Atg7 deficient (KO) and Atg7 bearing cells (WT) would respond to stress induced by paraquat (PQ), an oxidant drug commonly used to induce cellular senescence. Atg7 deficient KC displayed increased prostanoid signaling and a pro- mitotic gene expression signature as compared to the WT. After exposure to PQ, both WT and KO cells showed an inflammatory and stress-related transcriptomic response. However, the Atg7 deficient cells additionally showed drastic DNA damage- and cell cycle arrest signaling. Indeed, DNA fragmentation and -oxidation were strongly increased in the stressed Atg7 deficient cells upon PQ stress but also after oxidizing ultraviolet A irradiation. Damage associated phosphorylated histone H2AX (γH2AX) foci were increased in the nuclei, whereas expression of the nuclear lamina protein lamin B1 was strongly decreased. Similarly, in both, PQ treated mouse tail skin explants and in UVA irradiated mouse tail skin, we found a strong increase in γH2AX positive nuclei within the basal layer of Atg7 deficient epidermis. Atg7 deficiency significantly affected expression of lipid metabolic genes. Therefore we performed lipid profiling of keratinocytes which demonstrated a major dysregulation of cellular lipid metabolism. We found accumulation of autophagy agonisitic free fatty acids, whereas triglyceride levels were strongly decreased. Together, our data show that in absence of Atg7/autophagy the resistance of keratinocytes to intrinsic and environmental oxidative stress was severely impaired and resulted in DNA damage, cell cycle arrest and a disturbed lipid phenotype, all typical for premature cell aging.


Figures

fx1
Graphical abstract
Fig. 1.
Fig. 1
Gene regulation by paraquat in Atg7 bearing (WT) and Atg7 deficient (KO) mouse keratinocytes. Primary tail skin keratinocytes were treated with paraquat (20 µM) or left untreated for 48 h. Then RNA was extracted and global gene expression was assayed with microarray technology (Affymetrix mouse gene 2.0 ST). Numbers of up- and downregulated genes in untreated KO compared to WT KC (A), in PQ treated WT cells (D), and in PQ treated KO cells (G). Activation of canonical pathways and upstream regulators was analyzed using IPA software. Heatmaps depicting the p-value for activation of the pathways (B, E, H) and upstream regulators (C, F, I), respectively of both genotypes are shown. Heatmaps showing regulation by paraquat are shown for both genotypes next to each other, sorted for WT in E and F (yellow boxed) and for KO in H and I (yellow boxed). Next to the heatmaps the bar graphs indicate positive (red) or negative (green) activation z-scores for the listed pathways or upstream activators. Experiments were perfomed in triplicates; for A, D, G a p<0.05 (moderated t-statistics (LIMMA), Benjamini-Hochberg corrected) was regarded as significant. For B, C,E,F,H,I the top 5 pathways or regulators with a significant activation score (above 2 or below −2), are shown; pathways not significantly regulated in the other genotype are marked with “ns” within the heatmap. (For interpretation of the references to color in this figure legend, the reader is referred to the web version of this article.)
Fig. 2.
Fig. 2
Autophagy deficiency increases oxidative DNA damage. Keratinocytes were either sham treated or exposed to PQ (20 µM) or UVA (20 J/cm2) and DNA damage assayed 24 h (UVA) or 48 h (PQ) after stress with comet assay and 8-OhdG immunoassay. (A) Representative images of the comet assay perfomed on Atg7 bearing and Atg7 deficient cells. (B) Each bar represents the mean average of the tail moment (product of DNA in the tail and the mean distance of its migration) of 50 randomly selected cells. (C) Percentage of cells displaying DNA damage (comets). (D) 8-OHdG levels in were quantified by immunoassay. Samples were assayed in biological triplicates. Error bars in B-D indicate +/− SD (n=3), Significant differences upon treatment are indicated by §§ (p<0.01) and § (p<0.05), differences between WT and KO are indicated by **(p<0.01) and *(p<0.05) and were determined by ANOVA, followed by Student-Newman Keuls (SNK) post-hoc test.
Fig. 3.
Fig. 3
Lamin B1 in Atg7 deficient KC – accumulation in absence of stress, increased degradation upon PQ exposure. (A) Keratinocytes were exposed to PQ (20 µM) and LaminB1 protein was assayed with immunofluorescence microscopy after 48 h. Representative images of three independent experiments are shown. Lamin B1 protein was assayed by immunoblotting (B) and mRNA relative expression, normalized to beta-2-microglobulin expression was quantified by qPCR (C). The protein band intensities, normalized to Gapdh, of three independent experiments are shown in (D). Significant differences upon treatment are indicated by §§ (p<0.01) and § (p<0.05), differences between WT and KO are indicated by **(p<0.01) and *(p<0.05) and were determined by ANOVA, followed by Student-Newman Keuls (SNK) post-hoc test.
Fig. 4
Fig. 4
Cdk1, p53 and p21 regulation in autophagy deficient KC. Keratinocytes were exposed to PQ (20 µM) for 48 h and the relative mRNA expression of Cdk1 (A), p53 (C) and p21 (E) was quantified by pPCR (normalized to expression of beta-2-microglobulin). Protein levels of Cdk1 (B), p53 (D) and p21 (F) were assayed by immunoblotting and the protein band intensities, normalized to Gapdh, of three independent experiments are shown in the bar graphs below the blots (+/− SD of three independent experiments). Significant differences upon treatment are indicated by §§ (p<0.01) and § (p<0.05), differences between WT and KO are indicated by **(p<0.01) and *(p<0.05) and were determined by ANOVA, followed by Student-Newman Keuls (SNK) post-hoc test.
Fig. 5
Fig. 5
Increased γH2AX positive nuclei in stressed, Atg7 deficient KC in vitro (PQ, UVA), in tissue explants (PQ) and in vivo (UVA). (A) Keratinocytes were either sham treated or exposed to PQ (20 µM) or UVA (20 J/cm2) and γH2AX immunofluorescence was assayed 24 h (UVA) or 48 h (PQ) after stress. (B) Quantification of the percentage of γH2AX positive cells from three independent experiments (Bars +/− SD). (C) Tail skin explants were exposed to PQ (20 µM, 48 h), and sections were analyzed with immunohistochemistry for γH2AX. (D) Tails were irradiated in vivo with UVA (40 J/cm2), sections were prepared after 24 h and analyzed for γH2AX. For C, D representative pictures are show from one of two experiments with each three animals per group. (E, F) Quantification of positive nuclei in one representative experiment (n=3 per group; error bars: +/- SD). Significant differences upon treatment are indicated by §§ (p<0.01) and § (p<0.05), differences between WT and KO are indicated by **(p<0.01) and *(p<0.05) and were determined by ANOVA, followed by Student-Newman Keuls (SNK) post-hoc test.
Fig. 6
Fig. 6
GC/MS analysis of neutral lipid distribution and of fatty acid species, Total lipids were extracted from cultured WT and KO kerationcytes treated for 48 h with PQ (20 µM) or sham treated. A semiquantitative analysis of neutral lipids (free fatty acids, sterols and triglycerides) was performed by GC/MS. Relative amount of each lipid species was calculated from integrated area ratios. (A) Distribution of TG, FFA and Sterols within each group. (B) Distribution of the major FFA species within each group (n=3). Significant differences upon treatment are indicated by § (p<0.05), differences between WT and KO are indicated by *(p<0.05) and were determined by ANOVA, followed by Student-Newman Keuls (SNK) post-hoc test.

References

    1. Schafer M., Werner S. Nrf2--A regulator of keratinocyte redox signaling. Free Radic. Biol. Med. 2015;88:243–252. - PubMed
    1. Kammeyer A., Luiten R.M. Oxidation events and skin aging. Ageing Res. Rev. 2015;21:16–29. - PubMed
    1. Latonen L., Laiho M. Cellular UV damage responses--functions of tumor suppressor p53. Biochim. Biophys. Acta. 2005;1755:71–89. - PubMed
    1. Reeg S., Grune T. Protein oxidation in aging: does it play a role in aging progression? Antioxid. Redox Signal. 2015;23:239–255. - PMC - PubMed
    1. Pickering A.M., Linder R.A., Zhang H., Forman H.J., Davies K.J. Nrf2-dependent induction of proteasome and Pa28alphabeta regulator are required for adaptation to oxidative stress. J. Biol. Chem. 2012;287:10021–10031. - PMC - PubMed

Publication types

MeSH terms