

Ambient and laboratory evaluation of a low-cost particulate matter sensor
- PMID: 28012666
- PMCID: PMC10625486
- DOI: 10.1016/j.envpol.2016.12.039
Ambient and laboratory evaluation of a low-cost particulate matter sensor
Abstract
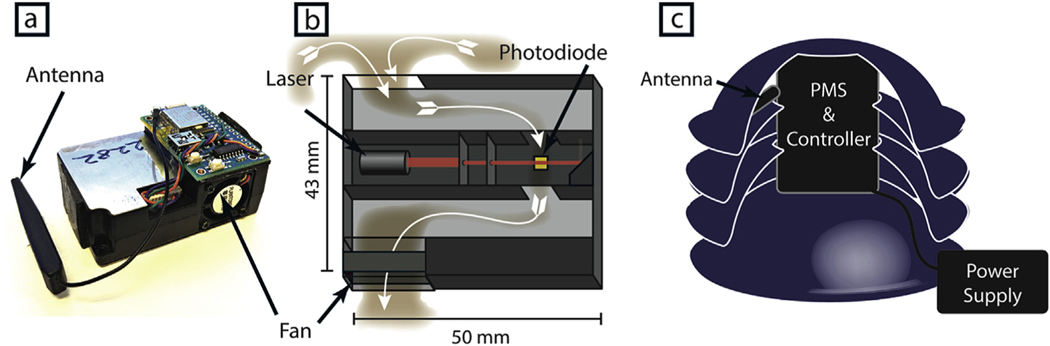
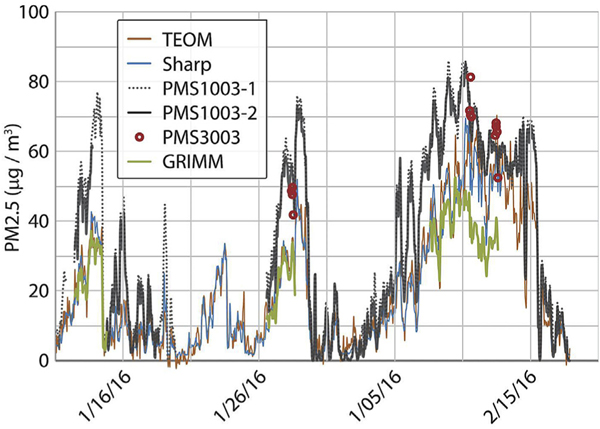
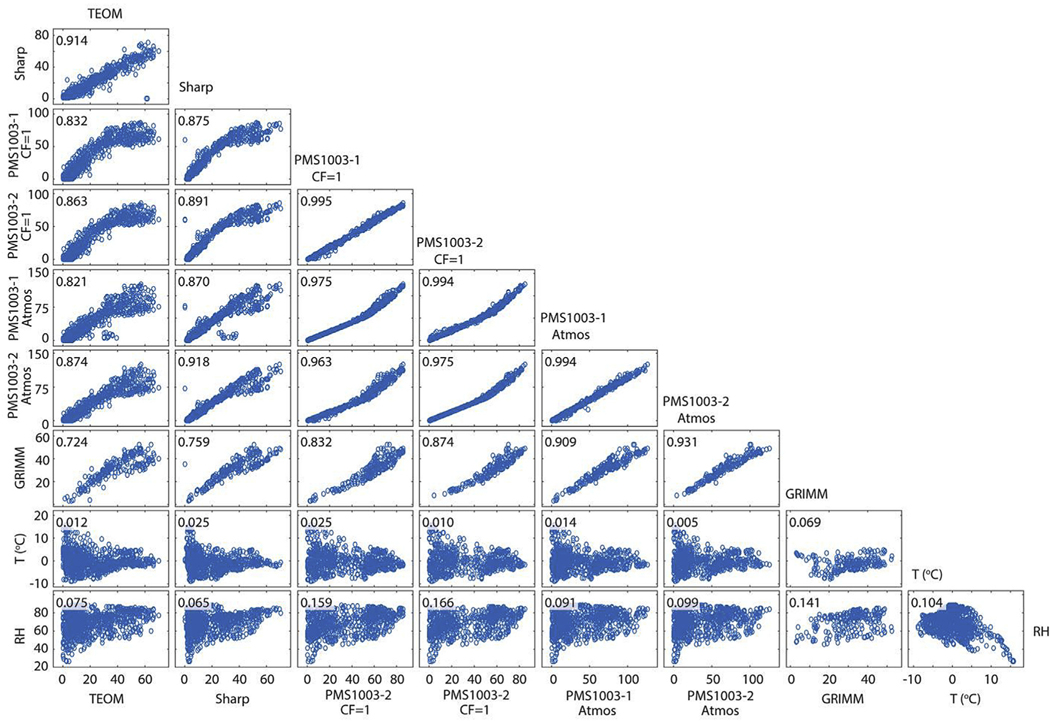
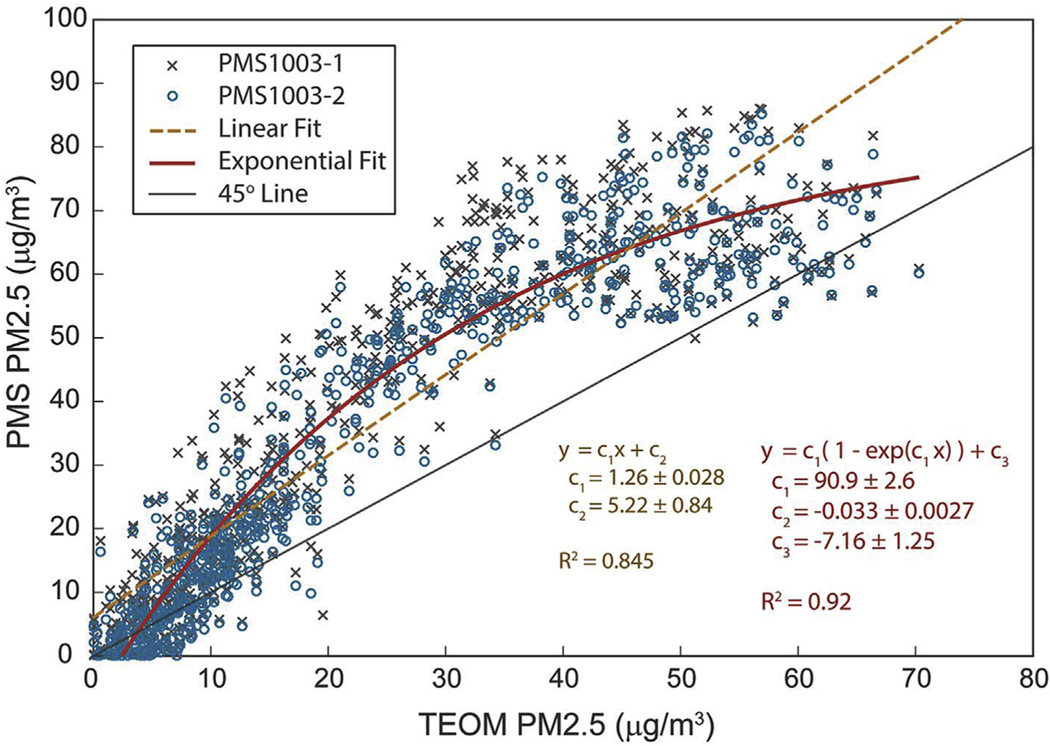
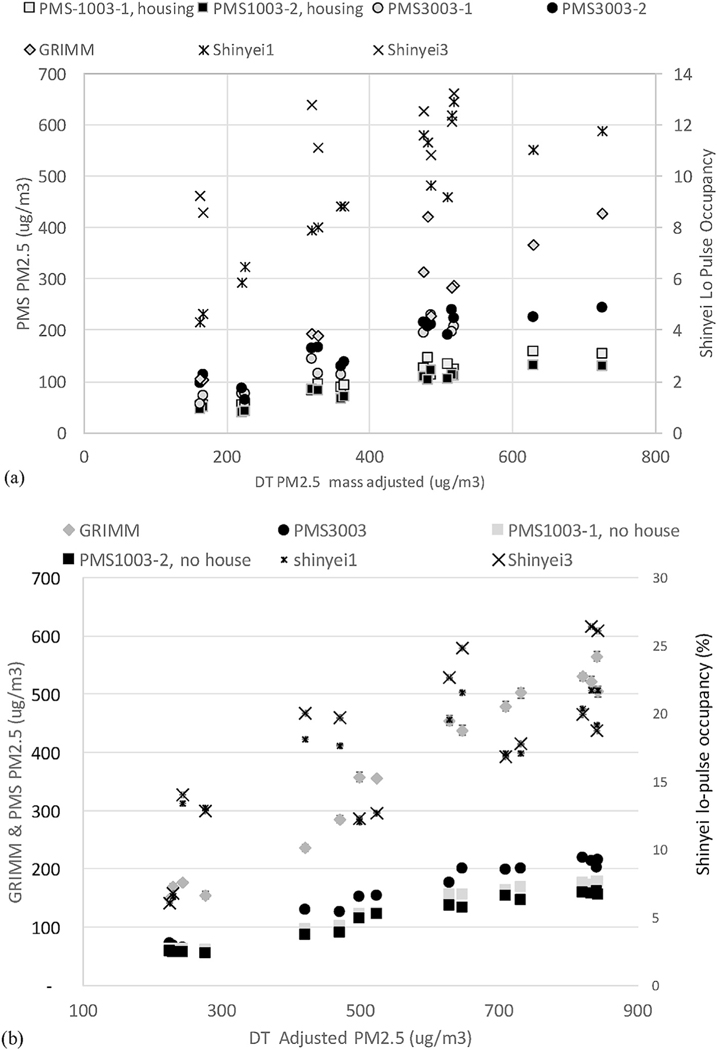
Low-cost, light-scattering-based particulate matter (PM) sensors are becoming more widely available and are being increasingly deployed in ambient and indoor environments because of their low cost and ability to provide high spatial and temporal resolution PM information. Researchers have begun to evaluate some of these sensors under laboratory and environmental conditions. In this study, a low-cost, particulate matter sensor (Plantower PMS 1003/3003) used by a community air-quality network is evaluated in a controlled wind-tunnel environment and in the ambient environment during several winter-time, cold-pool events that are associated with high ambient levels of PM. In the wind-tunnel, the PMS sensor performance is compared to two research-grade, light-scattering instruments, and in the ambient tests, the sensor performance is compared to two federal equivalent (one tapered element oscillating microbalance and one beta attenuation monitor) and gravimetric federal reference methods (FEMs/FRMs) as well as one research-grade instrument (GRIMM). The PMS sensor response correlates well with research-grade instruments in the wind-tunnel tests, and its response is linear over the concentration range tested (200-850 μg/m3). In the ambient tests, this PM sensor correlates better with gravimetric methods than previous studies with correlation coefficients of 0.88. However additional measurements under a variety of ambient conditions are needed. Although the PMS sensor correlated as well as the research-grade instrument to the FRM/FEMs in ambient conditions, its response varies with particle properties to a much greater degree than the research-grade instrument. In addition, the PMS sensors overestimate ambient PM concentrations and begin to exhibit a non-linear response when PM2.5 concentrations exceed 40 μg/m3. These results have important implications for communicating results from low-cost sensor networks, and they highlight the importance of using an appropriate correction factor for the target environmental conditions if the user wants to compare the results to FEM/FRMs.
Keywords: Air quality; Cold-air pool; Low-cost sensors; Particulate matter.
Copyright © 2016 Elsevier Ltd. All rights reserved.
Figures
References
-
- Afsarmanesh N, 2013. Smog blog: world-class pollution brings Tehran to a halt. Sci. Am March 2, 2013 https://blogs.scientificamerican.com/observations/smog-blog-world-class-....
-
- Bischoff P, n.d. New gadget precisely gauges indoor air pollution and finds places with clean air nearby. TechInAsia.
MeSH terms
Substances
Grants and funding
LinkOut - more resources
Full Text Sources
Other Literature Sources
