

Skin-Resident Effector Memory CD8+CD28- T Cells Exhibit a Profibrotic Phenotype in Patients with Systemic Sclerosis
- PMID: 28012718
- PMCID: PMC5433864
- DOI: 10.1016/j.jid.2016.11.037
Skin-Resident Effector Memory CD8+CD28- T Cells Exhibit a Profibrotic Phenotype in Patients with Systemic Sclerosis
Abstract
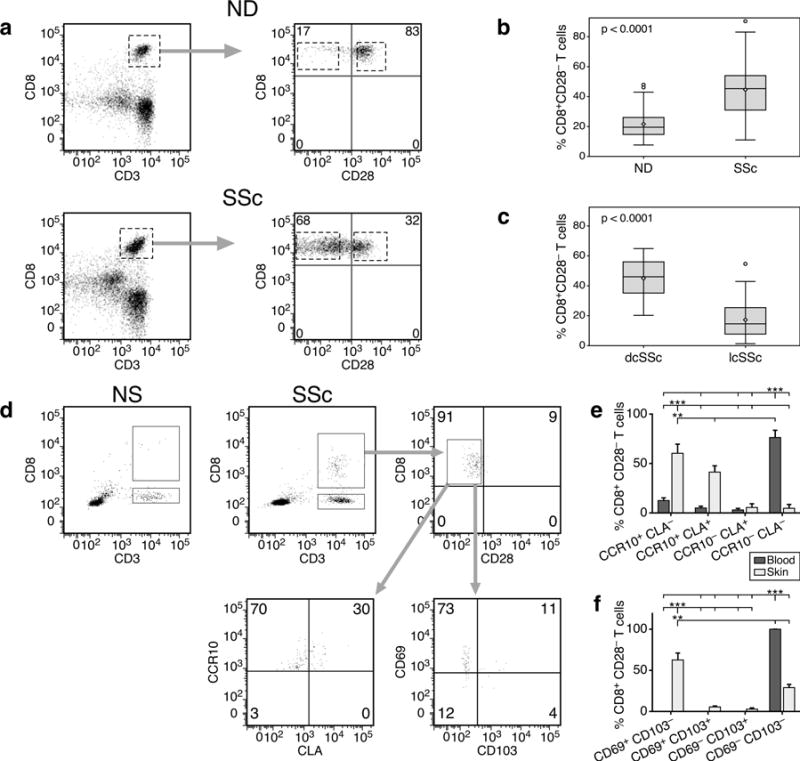
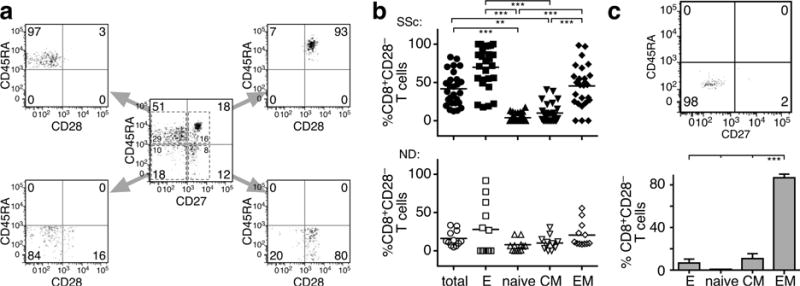
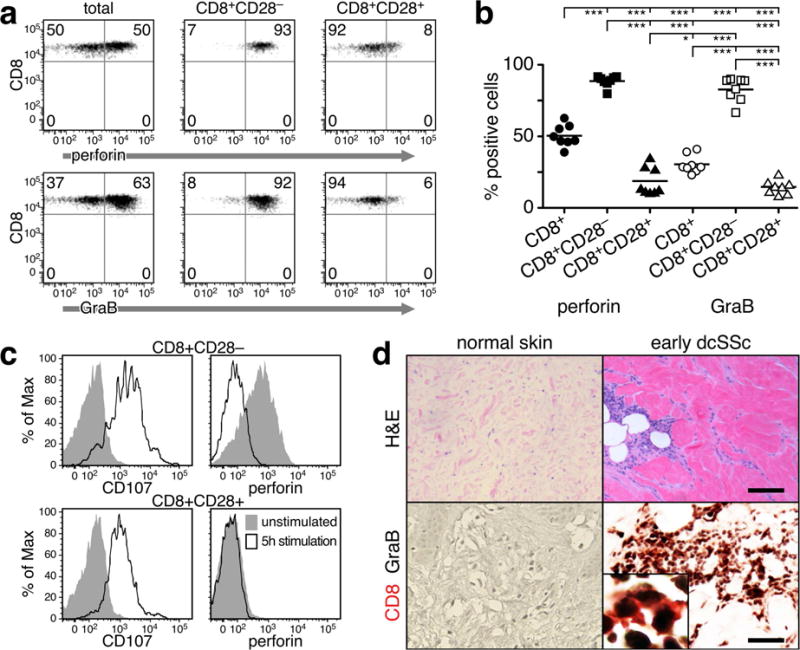
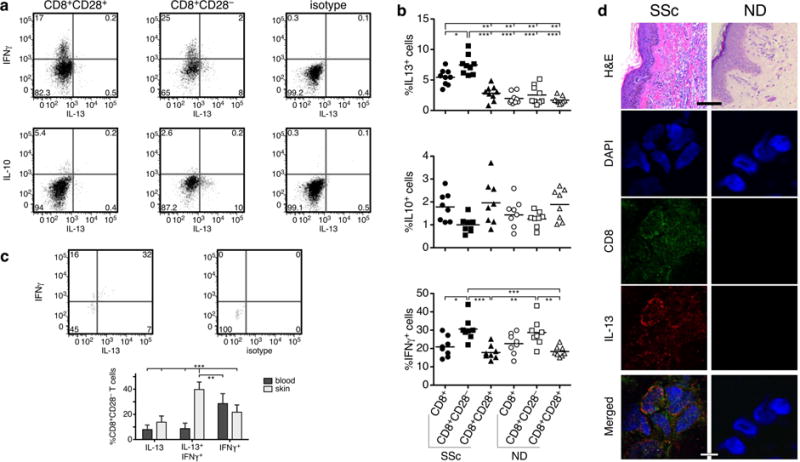
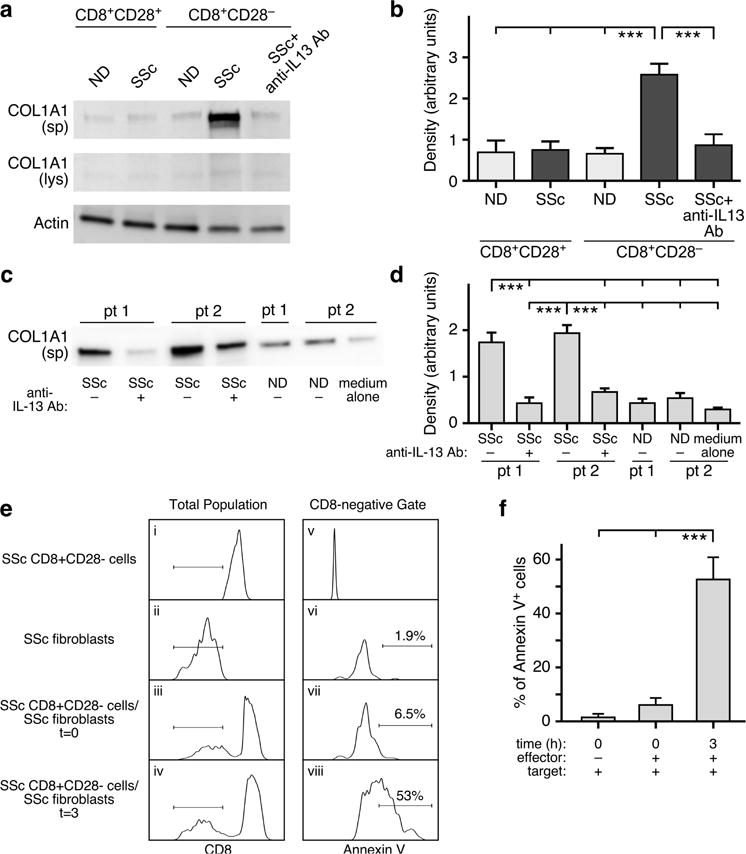
Loss of CD28 expression by CD8+ T cells occurs with age and during chronic inflammatory conditions. CD8+CD28- T cells are a heterogeneous cell subpopulation whose function ranges from immunosuppressive to effector. Here we analyzed the role of CD8+CD28- T cells in the pathogenesis of systemic sclerosis (SSc), a connective tissue disorder characterized by autoimmunity, vasculopathy, and extensive cutaneous and visceral fibrosis. We show that the frequency of CD8+CD28- T cells is increased in the blood and affected skin of SSc patients, independent of patient age, and correlates with the extent of skin fibrosis. We found that most skin-tropic CD8+CD28- T cells are resident in the skin lesions of patients in the early stage of the disease, exhibit an effector memory phenotype, and present a strong cytolytic activity ex vivo. Skin-resident and circulating SSc CD8+CD28- T cells produce high levels of the profibrotic cytokine IL-13, which induces collagen production by normal and SSc dermal fibroblasts. Thus, our findings indicate that CD8+CD28- T cells represent a pathogenic T-cell subset in SSc and likely play a critical role in the early stage of SSc skin disease.
Copyright © 2016 The Authors. Published by Elsevier Inc. All rights reserved.
Conflict of interest statement
The authors declare that no competing financial interests or conflicts exist.
Figures
Comment in
-
Toxic Memories in Systemic Sclerosis.J Invest Dermatol. 2017 May;137(5):1003-1004. doi: 10.1016/j.jid.2017.02.968. J Invest Dermatol. 2017. PMID: 28411831
Similar articles
-
Effector CD8+ T cells in systemic sclerosis patients produce abnormally high levels of interleukin-13 associated with increased skin fibrosis.Arthritis Rheum. 2009 Apr;60(4):1119-28. doi: 10.1002/art.24432. Arthritis Rheum. 2009. PMID: 19333920
-
Interleukin-13-producing CD8+ T cells mediate dermal fibrosis in patients with systemic sclerosis.Arthritis Rheum. 2013 Jan;65(1):236-46. doi: 10.1002/art.37706. Arthritis Rheum. 2013. PMID: 23001877 Free PMC article.
-
Current perspectives on the role of CD8+ T cells in systemic sclerosis.Immunol Lett. 2018 Mar;195:55-60. doi: 10.1016/j.imlet.2017.10.002. Epub 2017 Oct 5. Immunol Lett. 2018. PMID: 28987475 Free PMC article. Review.
-
Regulatory T cells produce profibrotic cytokines in the skin of patients with systemic sclerosis.J Allergy Clin Immunol. 2015 Apr;135(4):946-955.e9. doi: 10.1016/j.jaci.2014.12.1932. Epub 2015 Feb 10. J Allergy Clin Immunol. 2015. PMID: 25678090
-
T and NK Cell Phenotypic Abnormalities in Systemic Sclerosis: a Cohort Study and a Comprehensive Literature Review.Clin Rev Allergy Immunol. 2015 Dec;49(3):347-69. doi: 10.1007/s12016-015-8505-8. Clin Rev Allergy Immunol. 2015. PMID: 26445774 Review.
Cited by
-
The expanding impact of T-regs in the skin.Front Immunol. 2022 Sep 15;13:983700. doi: 10.3389/fimmu.2022.983700. eCollection 2022. Front Immunol. 2022. PMID: 36189219 Free PMC article. Review.
-
Harnessing CD8+CD28- Regulatory T Cells as a Tool to Treat Autoimmune Disease.Cells. 2021 Nov 1;10(11):2973. doi: 10.3390/cells10112973. Cells. 2021. PMID: 34831195 Free PMC article. Review.
-
Pathogenic Roles of Autoantibodies and Aberrant Epigenetic Regulation of Immune and Connective Tissue Cells in the Tissue Fibrosis of Patients with Systemic Sclerosis.Int J Mol Sci. 2020 Apr 27;21(9):3069. doi: 10.3390/ijms21093069. Int J Mol Sci. 2020. PMID: 32349208 Free PMC article. Review.
-
Patterns of T-Cell Phenotypes in Rheumatic Diseases From Single-Cell Studies of Tissue.ACR Open Rheumatol. 2021 Sep;3(9):601-613. doi: 10.1002/acr2.11296. Epub 2021 Jul 13. ACR Open Rheumatol. 2021. PMID: 34255929 Free PMC article. Review.
-
Functional heterogeneity of human skin-resident memory T cells in health and disease.Immunol Rev. 2023 Jul;316(1):104-119. doi: 10.1111/imr.13213. Epub 2023 May 5. Immunol Rev. 2023. PMID: 37144705 Free PMC article. Review.
References
-
- Abedin S, Michel JJ, Lemster B, Vallejo AN. Diversity of NKR expression in aging T cells and in T cells of the aged: the new frontier into the exploration of protective immunity in the elderly. Exp Gerontol. 2005;40:537–48. - PubMed
-
- Aktas E, Kucuksezer UC, Bilgic S, Erten G, Deniz G. Relationship between CD107a expression and cytotoxic activity. Cell Immunol. 2009;254:149–54. - PubMed
-
- Appay V, Dunbar PR, Callan M, Klenerman P, Gillespie GM, Papagno L, et al. Memory CD8+ T cells vary in differentiation phenotype in different persistent virus infections. Nat Med. 2002;8:379–85. - PubMed
-
- Betts MR, Brenchley JM, Price DA, De Rosa SC, Douek DC, Roederer M, et al. Sensitive and viable identification of antigen-specific CD8+ T cells by a flow cytometric assay for degranulation. J Immunol Methods. 2003;281:65–78. - PubMed
Publication types
MeSH terms
Substances
Grants and funding
LinkOut - more resources
Full Text Sources
Other Literature Sources
Medical
Research Materials
