. 2017 Apr:116:208-223.
doi: 10.1016/j.neuropharm.2016.12.020. Epub 2016 Dec 22.

Orbitofrontal participation in sign- and goal-tracking conditioned responses: Effects of nicotine

Affiliations

Orbitofrontal participation in sign- and goal-tracking conditioned responses: Effects of nicotine

Sierra J Stringfield et al. Neuropharmacology. 2017 Apr.

Abstract

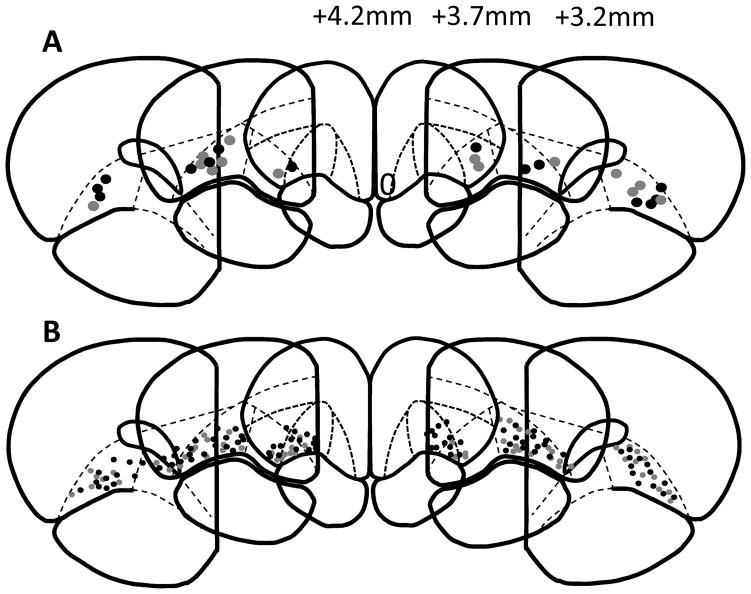
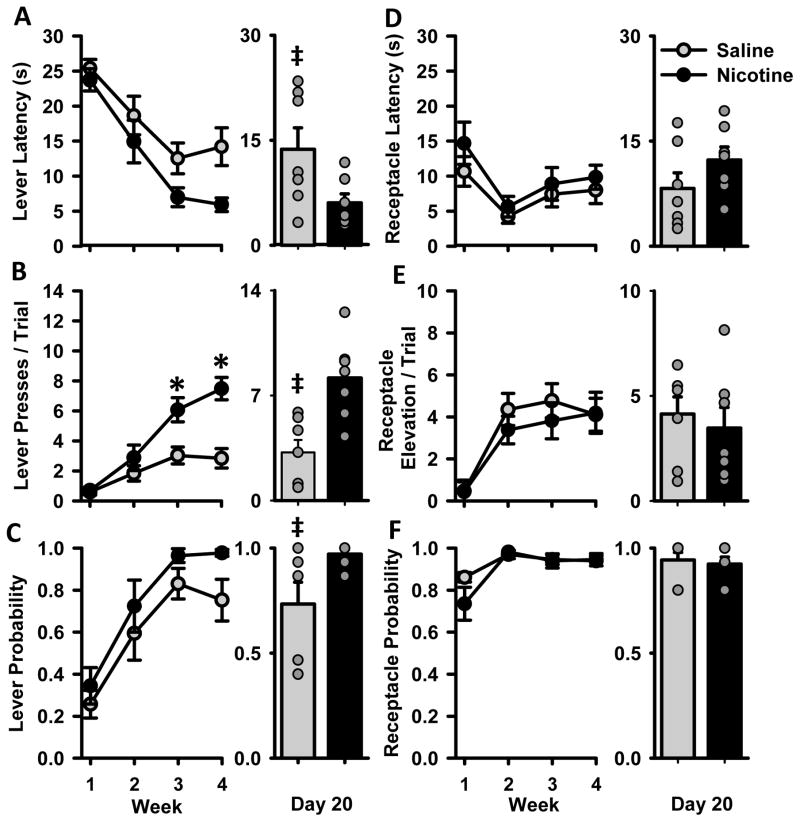
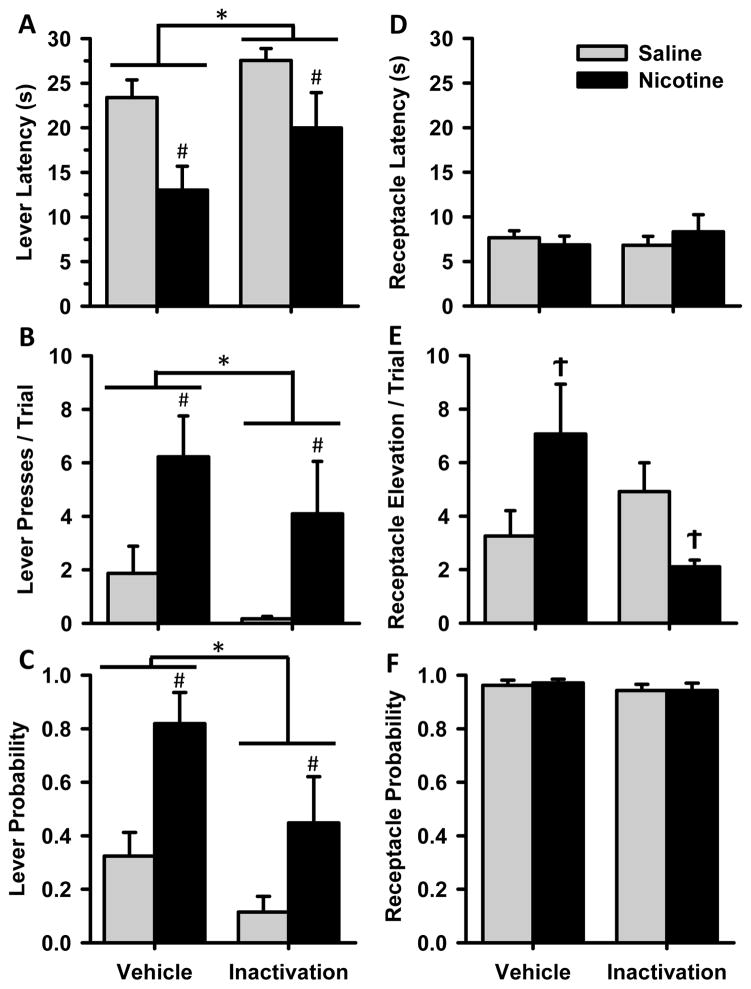
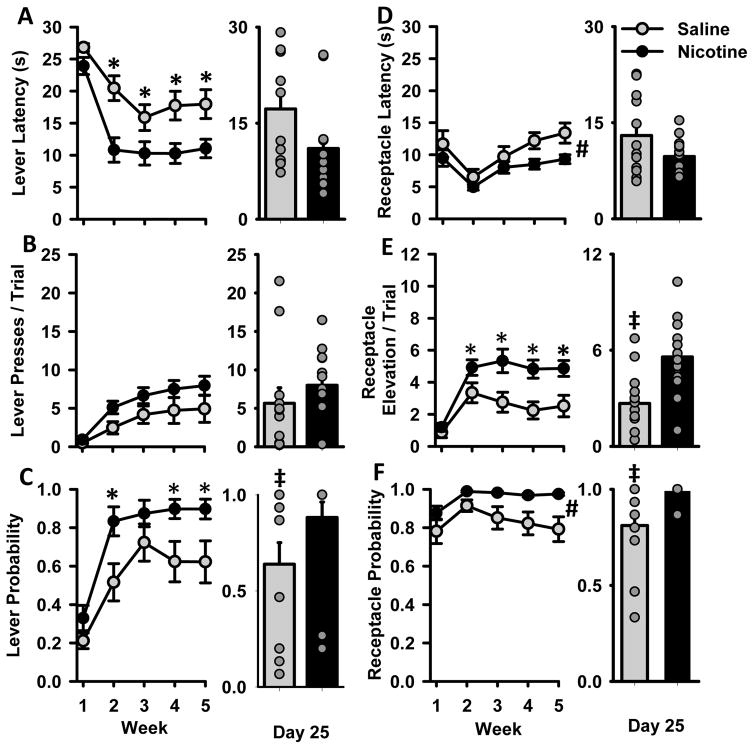
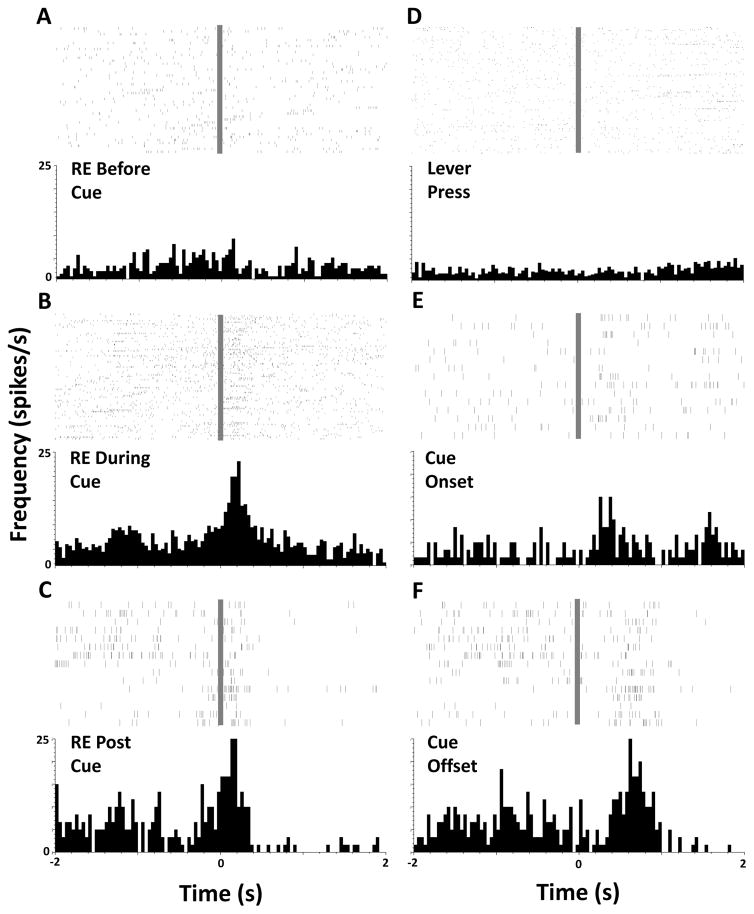
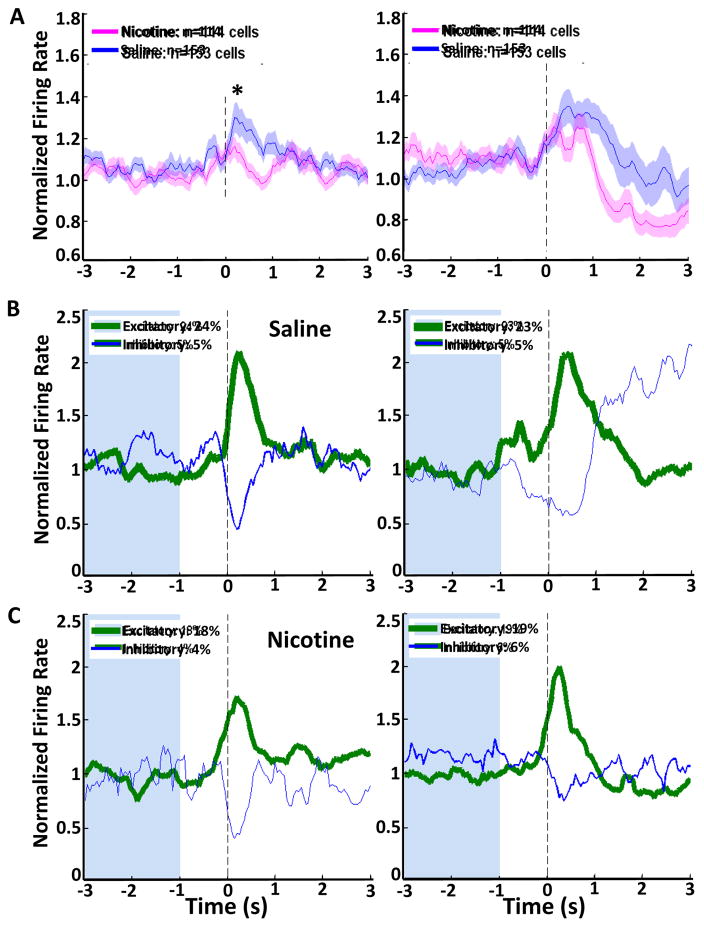
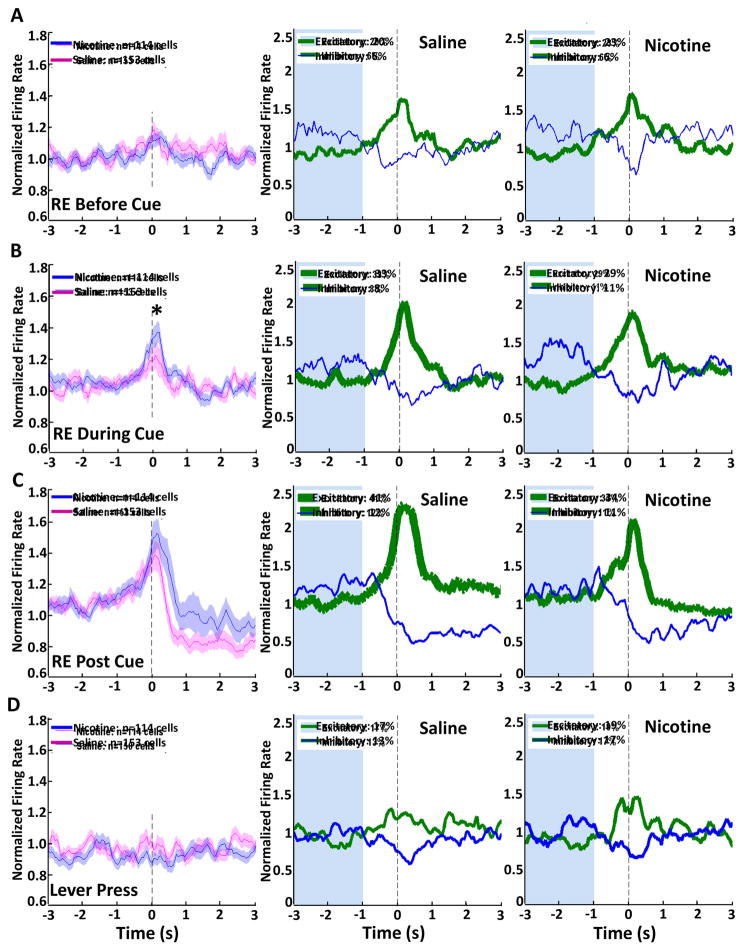
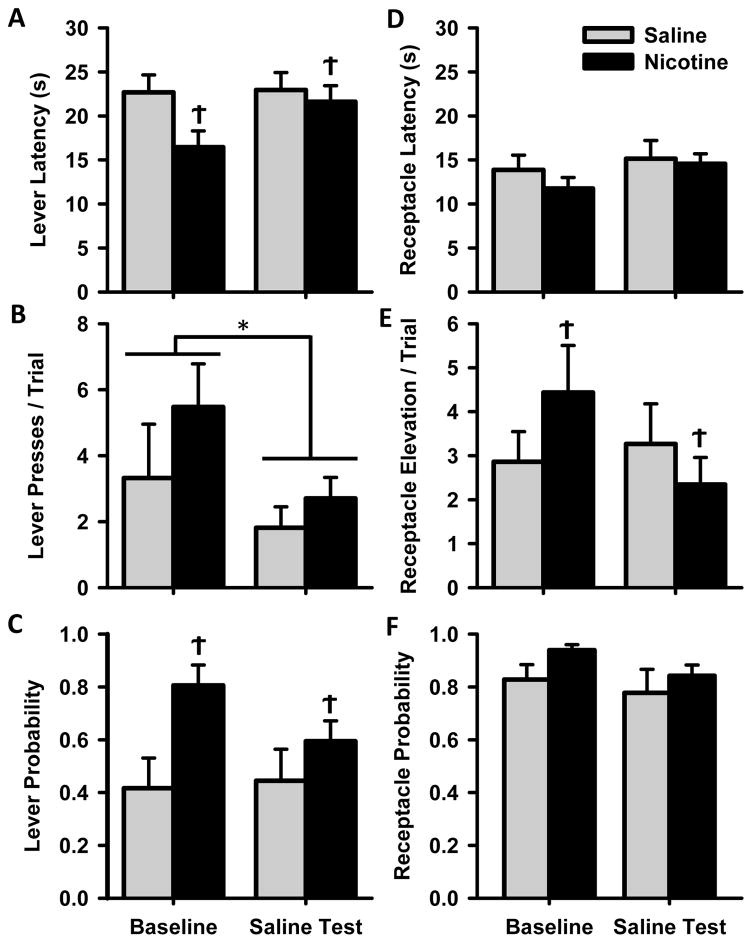
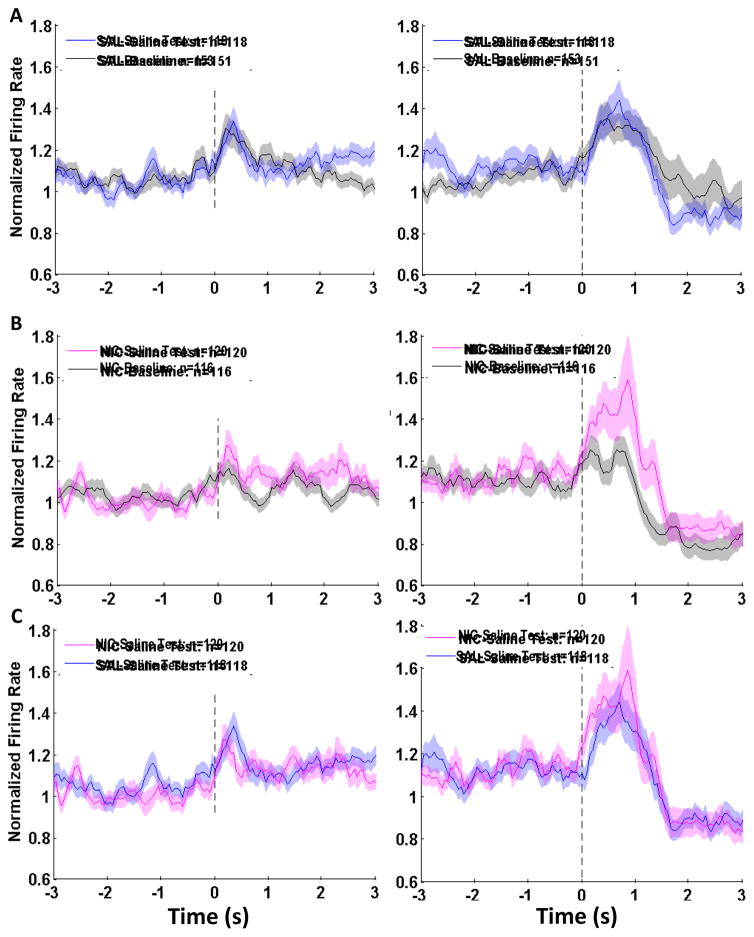
Pavlovian conditioned stimuli can acquire incentive motivational properties, and this phenomenon can be measured in animals using Pavlovian conditioned approach behavior. Drugs of abuse can influence the expression of this behavior, and nicotine in particular exhibits incentive amplifying effects. Both conditioned approach behavior and drug abuse rely on overlapping corticolimbic circuitry. We hypothesize that the orbitofrontal cortex (OFC) regulates conditioned approach, and that one site of nicotine action is in the OFC where it reduces cortical output. To test this, we repeatedly exposed rats to 0.4 mg/kg nicotine (s.c.) during training and then pharmacologically inactivated the lateral OFC or performed in vivo electrophysiological recordings of lateral OFC neurons in the presence or absence of nicotine. In Experiment 1, animals were trained in a Pavlovian conditioning paradigm and behavior was evaluated after inactivation of the OFC by microinfusion of the GABA agonists baclofen and muscimol. In Experiment 2, we monitored phasic firing of OFC neurons during Pavlovian conditioning sessions. Nicotine reliably enhanced conditioned responding to the conditioned cue, and inactivation of the OFC reduced conditioned responding, especially the sign-tracking response. OFC neurons exhibited phasic excitations to cue presentation and during goal tracking, and nicotine acutely blunted this phasic neuronal firing. When nicotine was withheld, both conditioned responding and phasic firing in the OFC returned to the level of controls. These results suggest that the OFC is recruited for the expression of conditioned responses, and that nicotine acutely influences this behavior by reducing phasic firing in the OFC.

Keywords: Electrophysiology; Goal tracking; Inactivation; Nicotine; Orbitofrontal cortex; Rats; Sign tracking.


Conflict of interest statement

Notes: The authors declare no competing financial interest.

Figures

Figure 1
Figure 1
Representative schematics of cannula (A) and individual electrode wire (B) placements in rats from Experiments 1 and 2, respectively. AP distances from bregma are indicated in mm. Grey circles represent placements from SAL animals, black circles represent placements from NIC animals. Atlas images are adapted from Paxinos and Watson (1998).
Figure 2
Figure 2
Cue-evoked behavior during acquisition of Pavlovian conditioned approach behavior for animals in Experiment 1. Rats were trained for 20 days; data are collapsed across 4 weeks and presented as the mean ± SEM for SAL (grey circles) and NIC (black circles) rats. Figures A–F represent separate measures of sign and goal tracking behavior with bar graphs comparing groups only on the last day of training (Day 20): (A) Latencies to approach the lever (B) lever presses per trial (C) probability of pressing the lever, (D) latency to approach the receptacle (E) receptacle elevation scores per trial (F) probability of entering the receptacle. The right side of each panel depicts group behavior (mean ± SEM) on the last day of training (Day 20). Behavior of individual animals in each group on that day are represented by grey circles (note that some circles overlap, especially in the probability graphs). * week × group interaction p<0.05, ‡ difference between NIC and SAL groups on the last day of training, p<0.05.
Figure 3
Figure 3
Cue-evoked behavior after pharmacological inactivation of the OFC. Data are presented as mean ± SEM for NIC (black bars) and SAL (grey) groups after infusion of either vehicle or the GABA receptor agonists baclofen and muscimol into the OFC. Behavioral measures (A–F) are as described in Figure 2. * main effect of infusion p<0.05, # main effect of group p<0.05, Ϯ group × infusion interaction p<0.05.
Figure 4
Figure 4
Cue-evoked behavior during Pavlovian conditioned approach training for animals in Experiment 2. Rats were trained for 25 days and data are collapsed across 5 weeks and presented as mean ± SEM. Panels A–F depict behavior of NIC (black) and SAL (grey) groups, as described in Figure 2. The right side of each panel depicts group behavior (mean ± SEM) on the last day of training (Day 25). Behavior of individual animals in each group on that day are represented by grey circles (note that some circles overlap, especially in the probability graphs). * group × week interaction p<0.05, # main effect of group p<0.05, ‡ difference between groups on Day 25 of training.
Figure 5
Figure 5
Rasters and perievent histograms depicting phasic activity of one individual example neuron. Panels A–F represent individual spikes and averaged firing rate during a 4-second period surrounding an event of interest at time=0 s (grey bar). Events of interest are noted on each panel, RE = receptacle entry.
Figure 6
Figure 6
Single unit electrophysiological recordings at cue onset or offset during a Pavlovian conditioning session. (A) Neuronal population activity in the OFC is presented as mean firing rate (±SEM, shaded) and normalized to whole session firing rate for nicotine-exposed (pink) and saline (blue) animals at cue onset and cue offset. (B, C) Phasic firing patterns of neurons that significantly changed their firing rate surrounding either cue offset or cue onset, for SAL (B) and NIC (C) groups. Green histograms represent cells that increased their firing rate, and blue histograms represent cells that decreased their firing rate, line thickness represents the proportion of cells displaying each phasic pattern. (*) significant difference in peak firing rate between groups, p<0.05.
Figure 7
Figure 7
Single unit electrophysiological recordings during behavioral responses in a Pavlovian conditioning session. (A–D, left column) Neuronal population activity in the OFC is presented as mean firing rate (±SEM, shaded) and normalized to whole session firing rate for nicotine-exposed (pink) and saline-control (blue) animals centered on behavioral responses. Phasic firing patterns of neurons that significantly changed their firing rate surrounding behavioral events are depicted for SAL (center column) and NIC (right column) groups. Green histograms represent cells that increased their firing rate, and blue histograms represent cells that decreased their firing rate, line thickness represents the proportion of cells displaying each phasic pattern. (*) significant difference in peak firing rate between groups, p<0.05.
Figure 8
Figure 8
Cue-evoked behavior during the saline test session. Data are presented as mean ± SEM for NIC and SAL groups after injection with saline during the saline test session, or on a baseline day in which animals received the assigned drug or control injection. Behavioral measures (A–F) are as described in Figure 2. * main effect of test day p<0.05, Ϯ group × test day interaction p<0.05.
Figure 9
Figure 9
Single unit electrophysiological recordings at cue onset or offset during the saline test session. Neuronal population activity in the OFC is presented as mean firing rate (±SEM, shaded) and normalized to whole session firing rate for nicotine-exposed and saline-control animals at cue onset and cue offset. (A, B) Population firing rates in SAL animals on the saline test day (Panel A, blue histograms) and NIC animals (Panel B, pink histograms) compared to the baseline recording session depicted in Figure 6 (grey histograms). (C) Comparison of population activity from SAL (blue) and NIC (pink) animals on the saline test day. (*) significant difference in peak firing rate between groups, p<0.05.

Similar articles

Cited by

References

    1. Attwood AS, Penton-voak IS, Munafò MR. Effects of acute nicotine administration on ratings of attractiveness of facial cues. 2009;11:44–48. doi: 10.1093/ntr/ntn006. - DOI - PubMed
    1. Barik J, Wonnacott S. Molecular and cellular mechanisms of action of nicotine in the CNS. Handb Exp Pharmacol. 2009:173–207. doi: 10.1007/978-3-540-69248-5_7. - DOI - PubMed
    1. Benwell ME, Balfour DJ. The effects of acute and repeated nicotine treatment on nucleus accumbens dopamine and locomotor activity. Br J Pharmacol. 1992;105:849–56. - PMC - PubMed
    1. Brown PL, Jenkins HM. Auto-shaping of the pigeon’s key-peck. J Exp Anal Behav. 1968;11:1–8. doi: 10.1901/jeab.1968.11-1. - DOI - PMC - PubMed
    1. Burton AC, Kashtelyan V, Bryden DW, Roesch MR. Increased firing to cues that predict low-value reward in the medial orbitofrontal cortex. Cereb Cortex. 2014;24:3310–3321. doi: 10.1093/cercor/bht189. - DOI - PMC - PubMed

Publication types

MeSH terms