. 2017 Mar;197(3):312-321.
doi: 10.1016/j.jsb.2016.12.010. Epub 2016 Dec 21.

Nano-scale actin-network characterization of fibroblast cells lacking functional Arp2/3 complex

Affiliations

Nano-scale actin-network characterization of fibroblast cells lacking functional Arp2/3 complex

Karen L Anderson et al. J Struct Biol. 2017 Mar.

Abstract

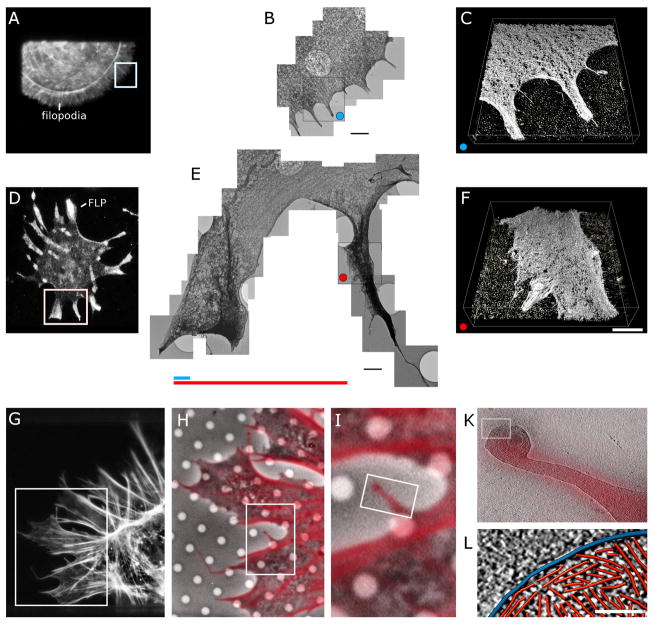
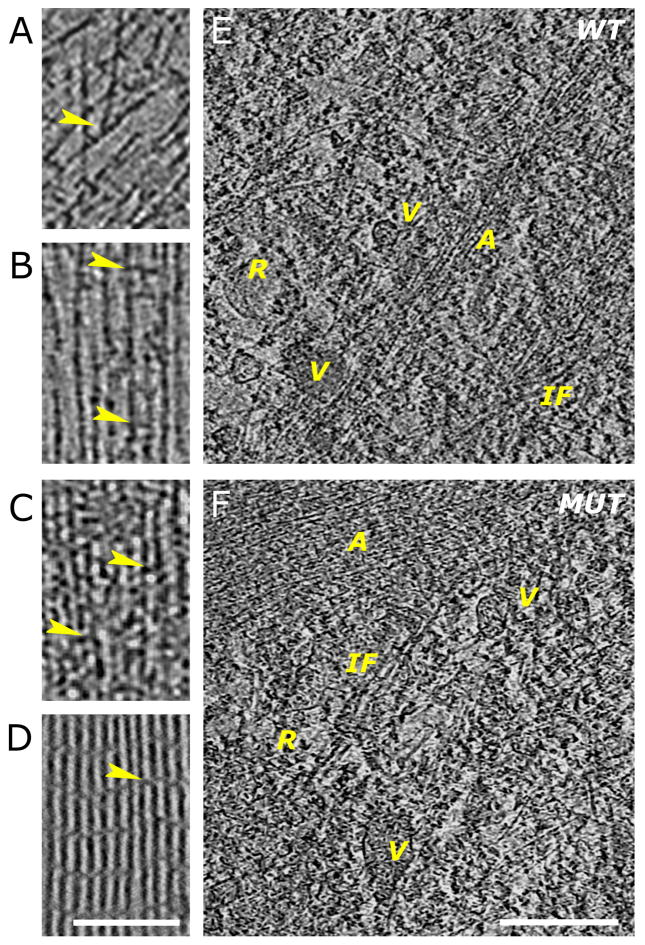
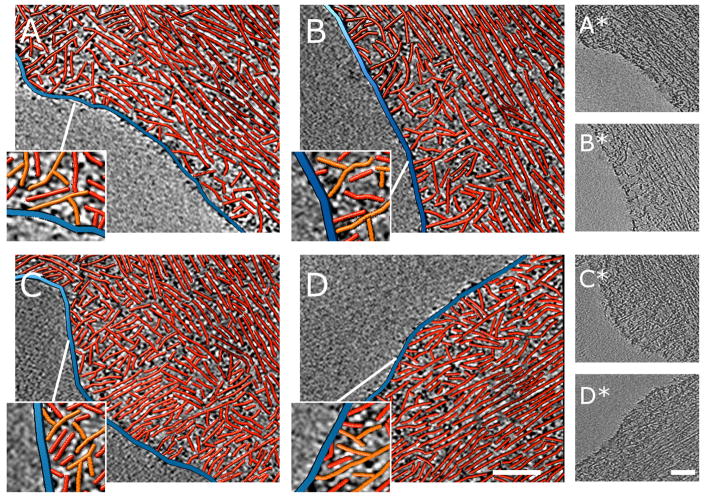
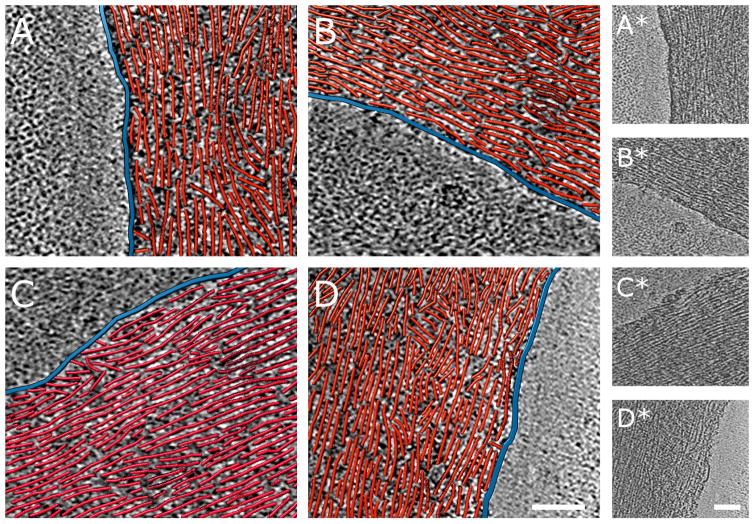
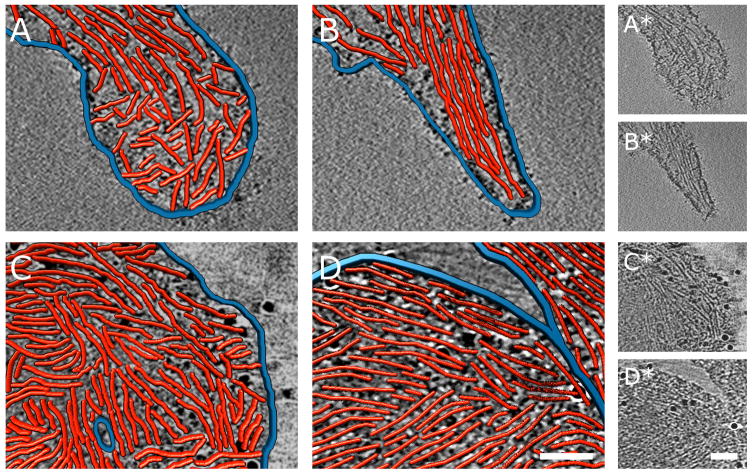
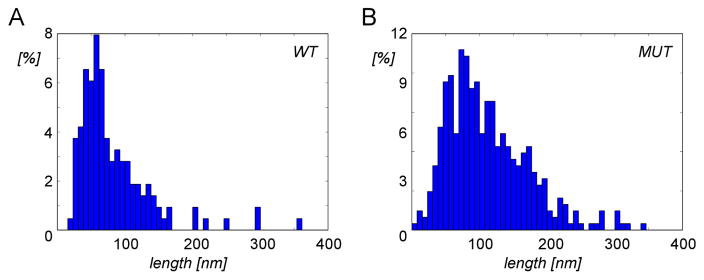
Arp2/3 complex is thought to be the primary protrusive force generator in cell migration by controlling the assembly and turnover of the branched filament network that pushes the leading edge of moving cells forward. However, mouse fibroblasts without functional Arp2/3 complex migrate at rates similar to wild-type cells, contradicting this paradigm. We show by correlative fluorescence and large-scale cryo-tomography studies combined with automated actin-network analysis that the absence of functional Arp2/3 complex has profound effects on the nano-scale architecture of actin networks. Our quantitative analysis at the single-filament level revealed that cells lacking functional Arp2/3 complex fail to regulate location-dependent fine-tuning of actin filament growth and organization that is distinct from its role in the formation and regulation of dendritic actin networks.

Keywords: Actin networks; Correlative imaging; Large-scale cellular cryo-tomography; Quantitative automated analysis.


Figures

Figure 1
Figure 1. Correlative fluorescence and electron microscopy of leading edge protrusions of wildtype and ARPC3−/− fibroblasts
A–C. Wild-type cell stained with AF546 phalloidin. A. Fluorescence micrograph. B. Collage of eleven overlapping three-dimensional electron tomograms of the cell protrusions marked by white box in (A). Bar is 1.5 μm. C. Surface representation of one of the three-dimensional reconstruction of the region marked by a blue dot in (B). Bar is 750 nm. D–F. ARPC3−/− cell stained with an antibody to fascin. D. Fluorescence micrograph. E. Collage of 23 overlapping electron tomograms of the protrusions in the region marked by white box in (D). Bar is 1.5 μm. The colored lines compare the average length of filopodia (blue) in wild-type cells and FLPs (red) in ARPC3−/− cells. The tomograms show the massive difference in the organization of filaments at the leading edge in cells with and without Arp2/3 complex. F. Surface representation of one of the three-dimensional reconstructions of the FLP region marked by a red dot in (E). Bar is 750 nm. G–L. Series of fluorescence and electron micrographs of an ARPC3−/− cell stained with AF546 phalloidin ranging from an overview of the cell to individual actin filaments. G. Fluorescence micrograph of half of the cell. H. Overlay of high power fluorescence and phase contrast images of the region marked by the rectangular white box in (I). I. Higher magnification of the region marked by the rectangular white box in (J). K. Overlay of the fluorescence and an 11.4-nm thick slice through a three-dimensional electron cryo-tomographic reconstruction of the FLP in the bifurcating region marked in (K). L. Three-dimensional renderings of traced actin filaments (red) and the plasma membrane (blue) in a 3.8-nm slice of the cryo-tomogram in (K). Bar is 100 nm.
Figure 2
Figure 2. Comparison of features in wild-type and ARPC3−/− fibroblasts at the nanometer scale
A–D. Examples showing 3.8-nm thick slices through three-dimensional cyro-tomograms. A. Region near the leading edge of a wild-type cell showing actin filaments running at different angles and branch junctions (arrowhead). B. Region in a filopodium of a wild-type cell showing parallel filaments separated by variable distances and with cross-linkers of different sizes (arrowheads). C. Region of an FLP in an ARPC3−/− mutant fibroblast showing closely packed parallel bundles of filaments with different size cross-linkers (arrowheads). D. Slice through a three-dimensional cryo-tomogram of a bundle of purified actin filaments cross-linked by fascin. The arrowhead points at a fascin cross-link between the actin filaments. Bar is 200 nm and applies to A–D. E–F. Features in the Interior region of wild-type (E) and ARPC3−/− (F) fibroblasts. Various vesicular structures (V) with different content and attachements are visible. Tentative intermediate filaments (IF) and ribosomes (R) can also be identified. The actin structures visible (A) are reminiscent of those at the cell edge. They are more loosely organised in the wild-type cells. 7.6-nm slices are shown, the bar is 500 nm.
Figure 3
Figure 3
Nanometer-scale characterization of actin filament assemblies at the cell peripheries of wild-type fibroblasts. Each example shows a 3.8-nm thick slice through a three-dimensional cyro-tomogram in grayscale with a paired three-dimensional rendering of red actin filaments and blue plasma membrane traced in the boxed areas of the reconstructions. The orientation of the slicing direction was adjusted so the long axis of the bundles is parallel to the plane of the slices. Only traced filaments contained in a thin slab (up to 4 slices) are shown to simplify visual appearance. In wild-type cells a narrow lamellipodial region of the cell periphery shows a dendritic network between the cell membrane (blue) and actin bundles running parallel to the cell membrane. The enlarged regions show branched actin filaments in orange. Bars are 160 nm. Raw tomogram slices of the traced regions are shown to the right.
Figure 4
Figure 4
Nanometer-scale characterization cell peripheries of ARPC3−/− fibroblasts. Each example shows a 3.8-nm thick slice through a three-dimensional cyro-tomogram in grayscale with a paired three-dimensional rendering of red actin filaments and blue plasma membrane traced in the boxed areas of the reconstructions. The periphery of ARPC3−/− fibroblasts shows a characteristic arrangement of actin filament bundles parallel to the edge and closely approaching the membrane. Bars are 160 nm. Raw tomogram slices of the traced regions are shown to the right.
Figure 5
Figure 5. Nanometer-scale comparison of the tips of FLPs of ARPC3−/− fibroblasts and of filopodia of their wild-type isogenic control cells. Each example shows a 3.8 nm thick slice through a three-dimensional cyro-tomogram in grayscale with a paired three-dimensional rendering of red actin filaments and blue plasma membrane traced in boxed areas of the reconstructions. Bars are 200 nm. Raw tomogram slices of the traced regions are shown to the right
A. Wild-type filopodium tip with ‘terminal cone’ geometry. B. Wild-type filopodium tip with parallel filaments. Figure S3 shows complementary information. D, E. Bulbous ARPC3−/− FLP tips with densely packed actin filaments. Occasionally, an FLP tip interacts with the shaft of another FLP as in (E).
Figure 6
Figure 6. Distributions of actin filament lengths within bundles in wild-type and ARPC3−/− fibroblasts
A–B. Normalized length distribution of actin filaments extracted from 30 randomly selected regions in wild-type (A) and in ARPC3−/− (B) fibroblasts. Both Mann-Whitney and Kolmogorov-Smirnov tests indicate a highly significant difference between the two length distributions (p ≪ 0.0001).

References

    1. Agulleiro JI, Fernandez JJ. Fast tomographic reconstruction on multicore computers. Bioinformatics. 2011;27:582–583. - PubMed
    1. Beli P, Mascheroni D, Xu D, Innocenti M. WAVE and Arp2/3 jointly inhibit filopodium formation by entering into a complex with mDia2. Nat Cell Biol. 2008;10:849–857. - PubMed
    1. Blanchoin L, Amann KJ, Higgs HN, Marchand JB, Kaiser DA, Pollard TD. Direct observation of dendritic actin filament networks nucleated by Arp2/3 complex and WASP/Scar proteins. Nature. 2000;404:1007–111. - PubMed
    1. Blanchoin L, Michelot A. Actin cytoskeleton: a team effort during actin assembly. Curr Biol. 2012;22:R643–R645. - PubMed
    1. Block J, Breitsprecher D, Kühn S, Winterhoff M, Kage F, Geffers R, Duwe P, Rohn JL, Baum B, Brakebusch C, Geyer M, Stradal TEB, Faix J, Rottner K. FMNL2 drives actin-based protrusion and migration downstream of Cdc42. Curr Biol. 2012;22:1005–1012. - PMC - PubMed

Publication types

LinkOut - more resources