. 2017 Jan 12;168(1-2):252-263.e14.
doi: 10.1016/j.cell.2016.11.036. Epub 2016 Dec 22.

An Actin Network Dispatches Ciliary GPCRs into Extracellular Vesicles to Modulate Signaling

Affiliations

An Actin Network Dispatches Ciliary GPCRs into Extracellular Vesicles to Modulate Signaling

Andrew R Nager et al. Cell. .

Abstract

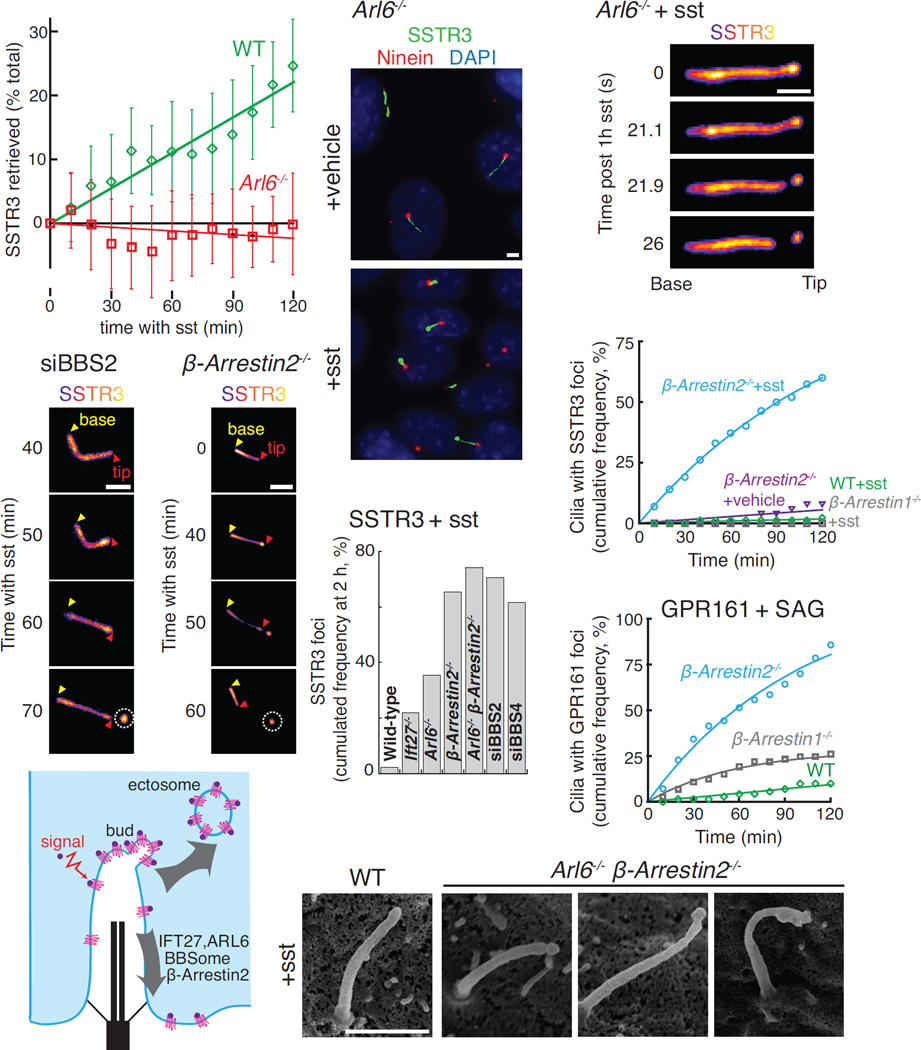
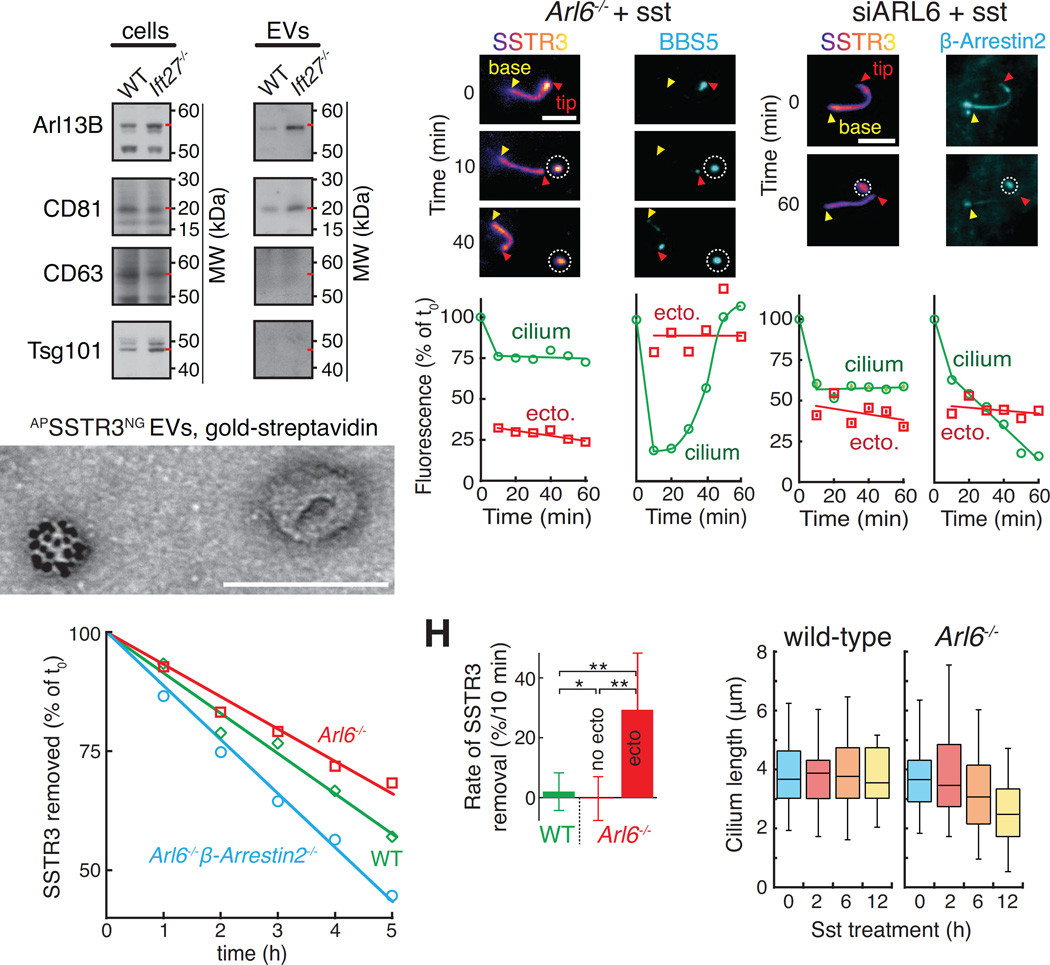
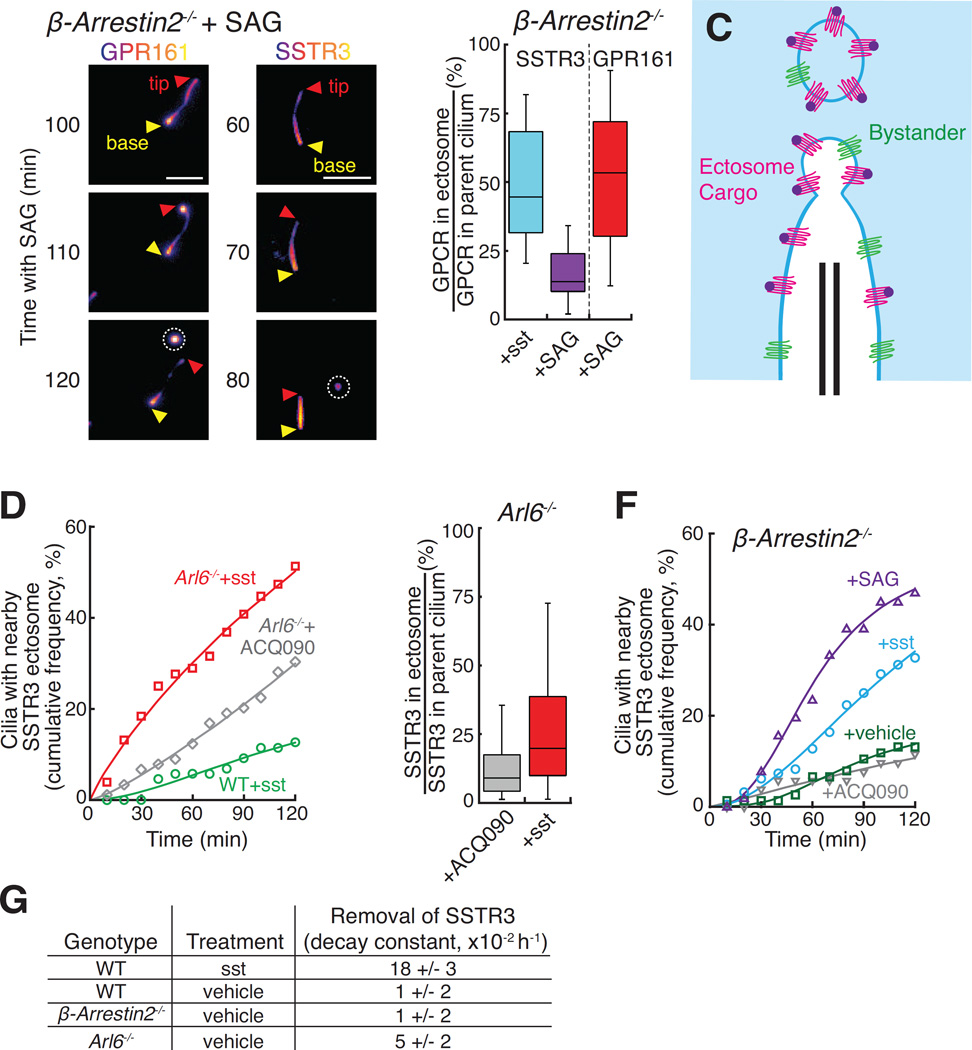
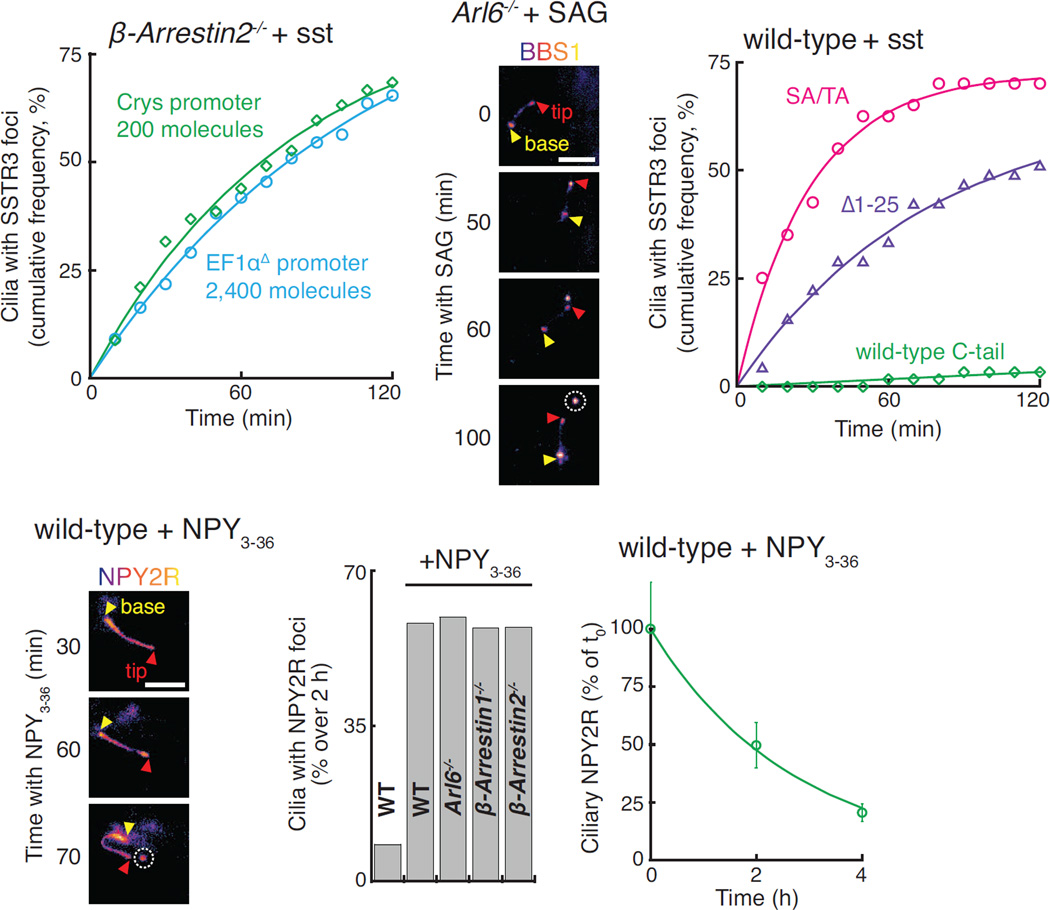
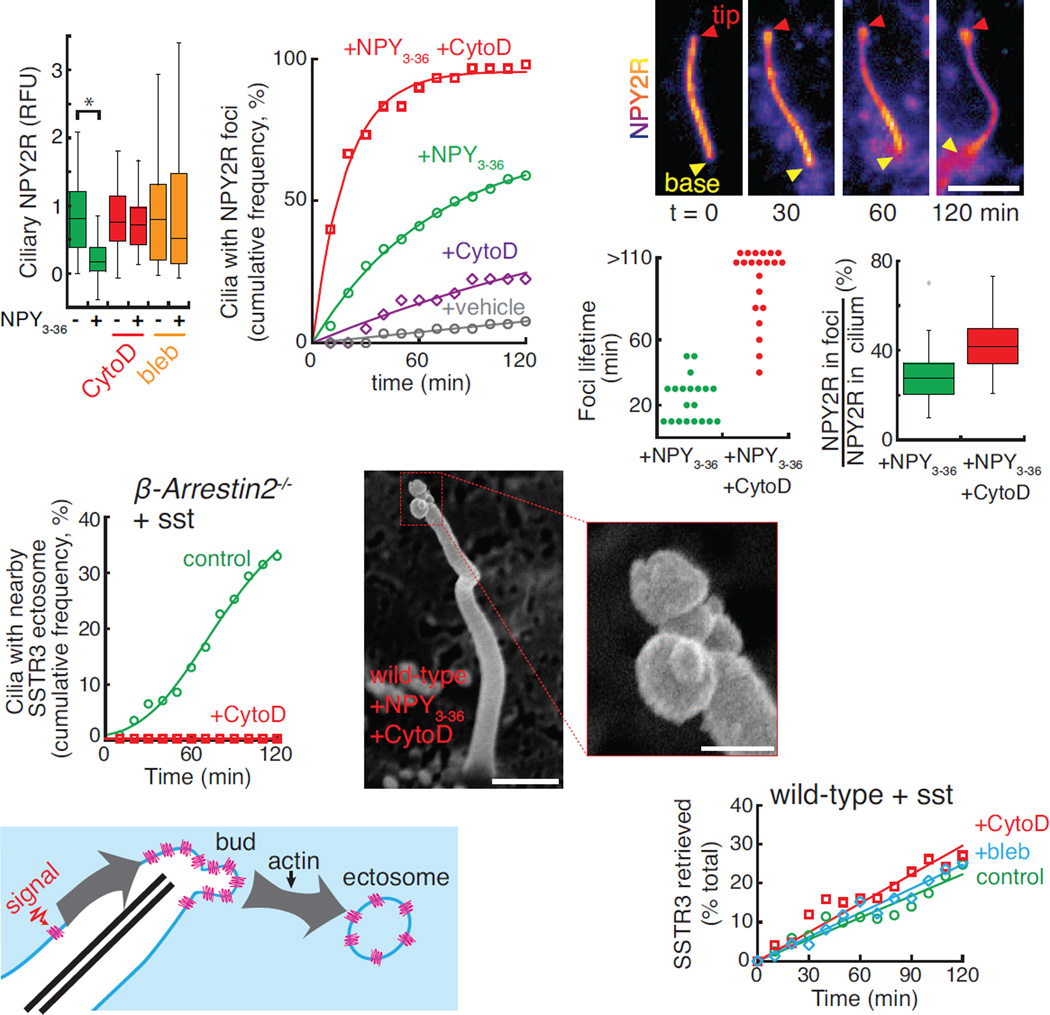
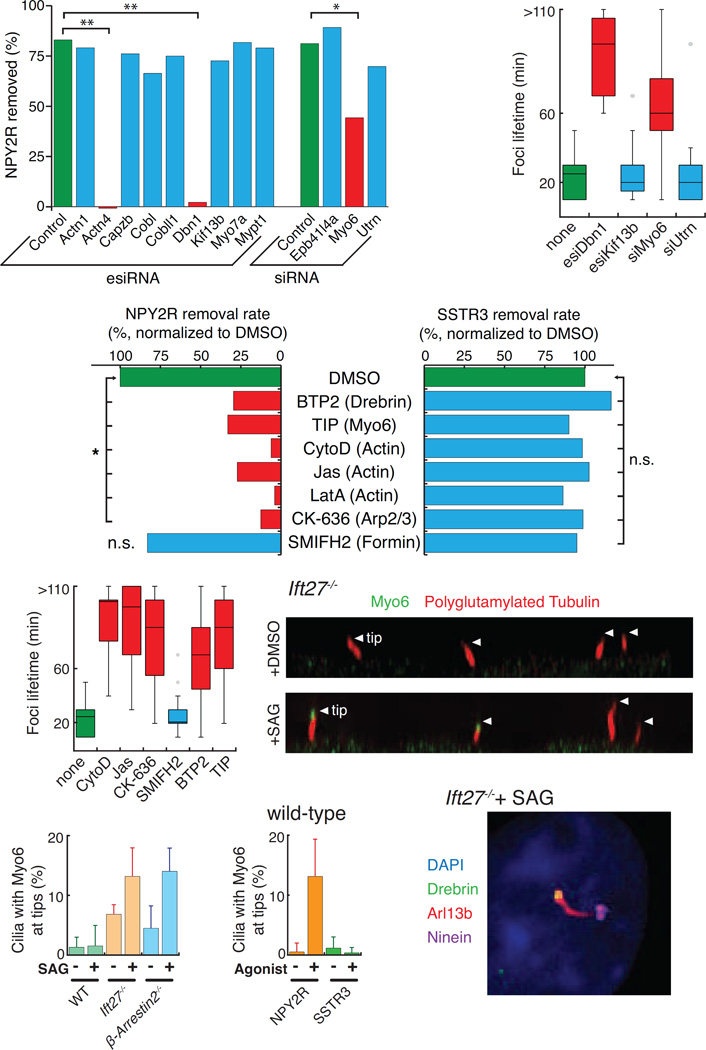
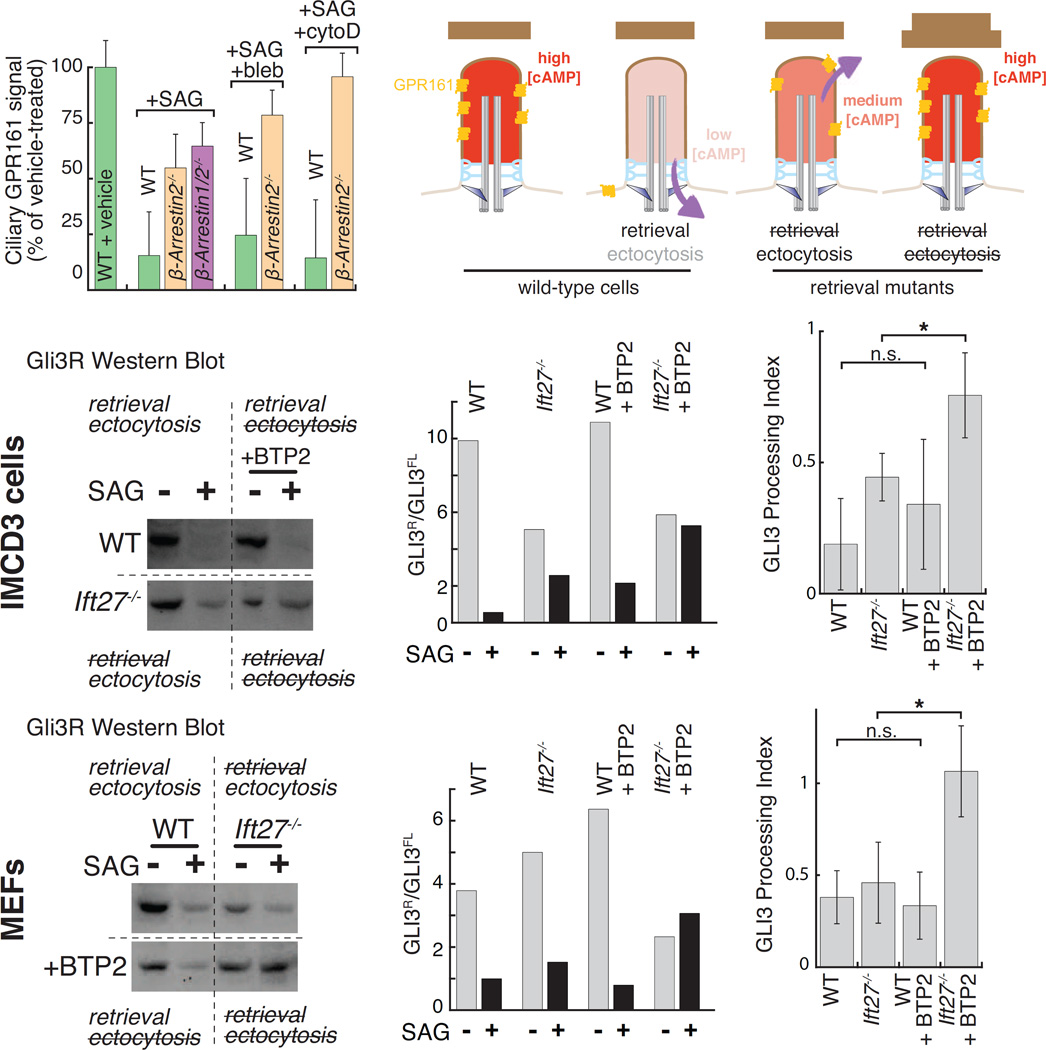
Signaling receptors dynamically exit cilia upon activation of signaling pathways such as Hedgehog. Here, we find that when activated G protein-coupled receptors (GPCRs) fail to undergo BBSome-mediated retrieval from cilia back into the cell, these GPCRs concentrate into membranous buds at the tips of cilia before release into extracellular vesicles named ectosomes. Unexpectedly, actin and the actin regulators drebrin and myosin 6 mediate ectosome release from the tip of cilia. Mirroring signal-dependent retrieval, signal-dependent ectocytosis is a selective and effective process that removes activated signaling molecules from cilia. Congruently, ectocytosis compensates for BBSome defects as ectocytic removal of GPR161, a negative regulator of Hedgehog signaling, permits the appropriate transduction of Hedgehog signals in Bbs mutants. Finally, ciliary receptors that lack retrieval determinants such as the anorexigenic GPCR NPY2R undergo signal-dependent ectocytosis in wild-type cells. Our data show that signal-dependent ectocytosis regulates ciliary signaling in physiological and pathological contexts.

Keywords: BBSome; GPCR; Hedgehog; actin; cilia; drebrin; exosomes; extracellular vesicles; myosin 6.


Figures

Figure 1
Figure 1. Un-retrieved GPCRs are ectocytosed
(A) ARL6 is necessary for retrieval of activated SSTR3. APSSTR3NG was stably expressed in IMCD3 cells under the control of an EF1α promoter lacking the TATA box (pEF1αΔ). APSSTR3NG was pulse-labeled with SA647 before addition of sst to WT and Arl6−/− cells and fluorescence intensity was tracked in individual cilia. Ectocytic-based removal of SSTR3 was not counted in order to measure only retrieval (see STAR Methods for details). Data were linearly fitted. Error bars: SD. (n=14–35 cilia) (B) Activated SSTR3 accumulates at the ciliary tip in Arl6−/− cells. IMCD3-[APSSTR3NG];Arl6−/− cells were treated with vehicle or sst for 6 h, fixed, and immunostained for ninein to mark the base of the cilium. (C) Release of a SSTR3-rich ectosome from the cilium tip. SA647-labeled IMCD3-[APSSTR3];Arl6−/− cells were treated with sst for 1 h and then imaged at 1.21 Hz. (D–E) SSTR3 ectocytosis from BBS2-depleted (D) and β-arrestin2−/− knockout (E) cells. IMCD3-[APSSTR3NG] cells were imaged in the NeonGreen channel every 10 min following addition of sst. In all subsequent time series, yellow and red triangles point to the base and tip of cilia respectively and the ectosome is circled. (G) SSTR3 foci formation in various retrieval mutants and knockdowns. Data was acquired as in panels D and E and the cumulated foci frequency over 2 h was plotted. (n=50–87 cilia) (H) Formation of SSTR3-enriched tip foci requires active signaling and defective retrieval. IMCD3-[APSSTR3NG] cells were imaged every 10 min following addition of sst or vehicle and tip foci were scored in the NeonGreen channel. Data were fitted to a simple exponential. (n=50–76 cilia). (I) Activation of the Hedgehog pathway in β-arrestin2−/− cells leads to the formation of GPR161 tip foci (see also Fig. 3A). IMCD3-[pCrys-APGPR161NG3] cells, either wild-type or knockout for β-Arrestin 1 or 2, were imaged following addition of SAG and scored and fitted as in panel (G). (n=71–73 cilia). (J) Model illustrating the competing removal modalities of activated GPCRs. (K) Scanning EM reveals buds at the ciliary tip in retrieval-defective cells. WT or Arl6−/− β-arrestin2−/− IMCD3-[APSSTR3NG] cells were treated with sst for 1 h before fixation. Additional examples and counting statistics are in Fig. S1C–D. All scale bars are 2 µm.
Figure 2
Figure 2. Efficiency of ciliary ectocytosis
(A–B) Characterization of EV preparations from ciliated cells. (A) Immunoblots of EVs purified from the culture supernatant of IMCD3 cells treated with SAG for 16h. Red dashes point to the known molecular weights of each antigen. Lysate and EV lanes contained 1 and 100 cell equivalents, respectively. The CD63 and Tsg101 blots of EV fractions were exposed longer to emphasize the absence of bands. (B) Imaging of EVs reveals a population of vesicles packaged with ciliary GPCRs. EVs from sst-stimulated IMCD3-[APSSTR3NG]; β-arrestin2−/− cells were labeled with streptavidin-conjugated gold particles and imaged by negative stain EM. See Fig. S2A for diagram and S2B–C for controls and additional examples. Scale bar: 100 nm. (C–D) SSTR3 and the BBSome are lost by ectocytosis. (C) A representative cilium from a sst-treated and SA647-labeled IMCD3-[APSSTR3,NG3BBS5];Arl6−/− cell was tracked for 1 h following ectosome release. The ectosome is circled. Fluorescence levels for the cilium and ectosome are quantified in (D). No photobleaching corrections were applied. Scale bar: 4 µm. (E–F) Significant amounts of ciliary β-Arrestin 2 are lost by ectocytosis. (E) SA647-labeled Arl6-depleted IMCD3-[APSSTR3, β-Arrestin2GFP] cells were imaged every 10 min for the 2 h following addition of sst. Fluorescence levels for the cilium and ectosome are quantified in (F). No photobleaching corrections were applied. Scale bar: 4 µm. (G) APSSTR3NG was pulse-labeled with SA647 before addition of sst to WT, Arl6−/−, and Arl6−/−/β-arrestin2−/− IMCD3-[APSSTR3NG] cells and tracking of fluorescence in individual cilia to measure removal. Data were linearly fitted. (n=27–33 cilia). (H) Substantial amounts of SSTR3 are lost in each round of ectocytosis. For all cilia tracked in Fig. 1A, we systematically measured the decrease in ciliary SSTR3 fluorescence between two successive frames (10 min frame rate) to calculate the instantaneous removal rate. For Arl6−/− cells, we separately analyzed transitions were no ectosome release event occurred (no ecto) from those where an ectocytosis event was detected (ecto). See STAR Methods for details. Error bars: SD. n= 167 for WT, 369 for Arl6−/− no ecto and 23 for Arl6−/− ecto. * = p<2×10⁻⁴, and ** = p<2×10⁻⁸ (Student’s t test). (I) Pervasive ectocytosis results in cilia shortening. The length of cilia in IMCD3-[APSSTR3NG] WT or Arl6−/− cells was tracked for 12 h following addition of sst by imaging the NeonGreen channel. The complete time course is shown in Fig. S3A. (n=45–62 cilia).
Figure 3
Figure 3. Specificity of ciliary ectocytosis
(A–B) Comparison of on- and off-pathway ectocytosis. (A) β-arrestin2−/− IMCD3-[APGPR161NG3] and β-arrestin2−/− IMCD3-[APSSTR3NG] cells were tracked in the NeonGreen channel following Hh pathway activation. GPR161 but not SSTR3 is highly enriched in ectosomes compared to cilia. Ectosomes are circled. Scale bar: 4 µm. (B) The NeonGreen intensity of ectosomes observed in experiments presented in Fig. 3A and 1E was quantified and normalized to the total NeonGreen intensity of the parent cilium. (n=24 ectosomes). (C) Diagram illustrating how activated GPCRs (red) are enriched in ectosomes while bystander proteins (green) undergo bulk flow ectocytosis. (D) Arl6−/− cells undergo both signal-dependent and constitutive ectocytosis. SA647-labeled WT or Arl6−/− IMCD3-[APSSTR3NG] cells were imaged following addition of sst or antagonist (ACQ090). The number of cilia with a nearby SSTR3 focus was scored. Data was fit to a Hill equation of no theoretical significance. (n=76–89 cilia). (E) Packaging efficiencies of constitutive and signal-dependent ectocytosis. Ectosomes observed in experiments presented in Fig. 3D were analyzed following the procedure used in Fig. 3B. (n=38–43 ectosomes). (F) Signal-dependent ectocytosis from β-arrestin2−/− cells. Ectosomes from SA647-labeled IMCD3-[APSSTR3NG]; β-arrestin2−/− cells were counted following addition of sst, SAG, ACQ090, or vehicle. Analysis and fitting was as in panel (D). (n=51–141 cilia). (G) Constitutive ectocytosis removes measurable levels of ciliary proteins. APSSTR3NG was pulse-labeled by SA647 and analyzed by fixed imaging after 6 or 9 h treatment with sst, vehicle, or SAG (see Fig. S3F). Data were fit to an exponential decay and the rate constants for SSTR3 removal are shown in the table. (n=222–327 cilia measured per rate constant).
Figure 4
Figure 4. NPY2R exits wild-type cilia by ectocytosis
(A) β-arrestin2−/− cells expressing APSSTR3NG3 under the control of the δ-crystallin (Crys) or pEF1αΔ-APSSTR3NG were imaged in the NeonGreen channel every 10 min for the 2 h following addition of sst. The number of molecules in cilia was determined using a fluorescently-tagged virus calibrator (see STAR methods). SSTR3 tip foci were scored and analyzed as in Fig. 1G. (n=55–57 cilia). (B) IMCD3-[NG3BBS1];Arl6−/− cells were imaged every 10 min for the 2 h following addition of SAG. Ectocytosis is evidenced by release of a NG3BBS1 focus as in Fig. 2C. (C) SSTR3 variants lacking retrieval determinants are ectocytosed from WT cells. IMCD3 cells expressing variants of APSSTR3 (described in Fig. S4A) were pulse-labeled with SA647 and imaged every 10 min for the 2 h following addition of sst. SSTR3 tip foci were scored and analyzed as in Fig. 1G. (n=40–60 cilia). (D–F) NPY2R is efficiently ectocytosed from WT cells. (D) IMCD3-[pEF1αΔ-NPY2RNG] cells were imaged every 10 min following treatment with the agonist NPY3–36. All scale bars are 4 µm. (E) The cumulated frequency of tip foci was scored by imaging IMCD3-[NPY2RNG] cell lines every 10 min for 2 h following addition of NPY3–36. (n=28–79 cilia). (F) IMCD3-[NPY2RNG] cells were pre-treated with the translation inhibitor emetine to prevent the appearance of newly synthesized NPY2RNG in cilia. Cells were then treated with NPY3–36 for 0, 2, or 4 h before fixation and quantitation of ciliary NeonGreen. Error bars: SEM. (n=30–54 cilia).
Figure 5
Figure 5. Ectosome release requires F-actin
(A) NPY2R exit requires actomyosin activity. Emetine-pretreated IMCD3-[NPY2RNG] cells were treated with NPY3–36 or vehicle and cytochalasin D (CytoD) or blebbistatin (bleb) for 4 h before fixation and quantitation of ciliary NeonGreen as in Fig. 4F. * indicates p<0.01 (Mann-Whitney U test). (n=30–67 cilia). (B) Actin poisoning causes an increased incidence of NPY2RNG tip foci. NPY2RNG tip foci were scored and analyzed as in Fig. 1G. (n=30–47 cilia). (C–E) Cytochalasin D stabilizes NPY2RNG tip foci. (C) Cytochalasin D-treated IMCD3-[NPY2RNG] cells were imaged every 10 min for 2 h following addition of NPY3–36. A tip focus appears at 30 min and lasts for the remainder of the observation period. (D) Dot plot showing the time between appearance and ectocytosis of NPY2R foci for either NPY3–36 or NPY3–36 plus cytochalasin D-treated cells. Most foci persist beyond the 2 h observation period in the presence of cytochalasin D. (E) The NeonGreen fluorescence of tip foci and cilia were measured and ratioed to plot the fraction of ciliary NeonGreen signal inside the foci. Failure to release ectosomes in cytochalasin D-treated cells results in hyperaccumulation of NPY2R at the tip. (n=20 foci). (F) SSTR3 ectocytosis is blocked by cytochalasin D. Ectosomes from untreated or cytochalasin D-treated IMCD3-[APSSTR3NG];β-arrestin2−/− cells were counted following addition of sst. Data were fit to a Hill equation of no theoretical significance. (n=55–141 cilia). (G) Cytochalasin D treatment results in the accumulation of multiple tip buds. IMCD3-[NPY2RNG] cells were treated with cytochalasin D and NPY3–36 for 1 h, fixed, and analyzed by scanning EM. Inset shows a magnification of the tip. Scale bars: 0.5 µm (main panel), 125 nm (inset). (H) Diagram illustrating the ectocytosis step mediated by actin. (I) SSTR3 retrieval remains unaffected by blebbistatin or cytochalasin D. SSTR3 removal from wild-type cilia is 95% reliant on retrieval (see STAR Methods). APSSTR3NG was pulse-labeled with SA647 before addition of sst to cells and tracking of fluorescence in individual cilia. (n=14–15 cilia).
Figure 6
Figure 6. An actin network mediates EV release at the ciliary tip
(A) Myosin 6, Drebrin, and α-Actinin 4 are required for NPY2R removal from cilia. IMCD3-[NPY2RNG] cells were depleted of the indicated proteins before measuring the decrease in median ciliary fluorescence of NPY2R upon 4 h treatment with NPY3–36 (see Fig. S5A for detailed distribution). To compare knockdowns, the relative amount of NPY2R lost from cilia was plotted (1 − CiliaryFluorescenceNPY/CiliaryFluorescencevehicle). Multiple regression analysis was used to identify significant decreases in amount of NPY2R removed: * indicates p < 0.02, and ** p < 0.002. (n=72–255 cilia). See STAR Methods for details. (B) Drebrin and Myosin 6 are necessary for ectosome release. NPY2R foci lifetimes were measured as in Fig. 5D (n=11–31 foci). (C–D) An actin-regulated machinery is required for ciliary ectocytosis but dispensable for retrieval. (C) GPCR removal was imaged in IMCD3-[NPY2RNG] or IMCD3-[APSSTR3NG] cells treated with 0.5 µM cytochalasin D (CytoD), 15 µM jasplakinolide (Jas), 1 µM latrunculin A (LatA), 1 µM BTP2, 25 µM TIP, 50 µM of the Arp2/3 inhibitor CK-636 or 25 µM of Formin 2 inhibitor SMIFH2 (Fig. S6A–E). Total removal rates were calculated as in Fig. 6A (NPY2R) and Fig. 2G (SSTR3) and normalized to the value for DMSO-treated cells. Statistical tests were as in Fig. 6A (n=123–298 cilia for NPY2R fixed imaging, n=11–14 cilia for SSTR3 live-cell imaging). See STAR Methods for details. (D) NPY2R foci lifetimes were measured as in Fig. 5D. Most foci persist beyond the 2 h observation period in the presence of cytochalasin D, jasplakinolide, CK-636, BTP2, or TIP. (n=20–39 foci). (E–G) Myosin 6 localizes to the tip of cilia in cells undergoing ectocytosis. WT, Ift27−/−, and β-arrestin2−/− cells were treated with DMSO or SAG for 1 h, fixed, and stained for endogenous myosin 6. (D) x-z projection showing myosin 6 at the tip of upward pointing Ift27−/− cilia in the presence of SAG but not with DMSO. White triangles point to the tips of cilia. (E) shows the frequency of myosin 6 at the tip of cilia for each genotype with or without SAG. (G) compares the frequency of cilia with myosin 6 at the tip in cells expressing NPY2RNG or APSSTR3NG and treated with the respective agonists. Error bars: SD between microscope fields. (n=78–322 cilia). (H) Drebrin localizes to cilia. Ift27−/− cells were treated with SAG for 1 h, fixed, and stained for endogenous drebrin, Arl13B and ninein. Drebrin localized near the tip, distal to the basal body marker ninein. All scale bars are 4 µm.
Figure 7
Figure 7. Ciliary exit pathways are required for the appropriate regulation of Hedgehog signaling
(A) Endogenous GPR161 is lost by ectocytosis in retrieval-defective cells. WT, β-arrestin2−/−, or Arrb1/2−/− cells were treated with vehicle or SAG, fixed, immunostained for GPR161 and ciliary fluorescence levels measured. As indicated, cells were treated with blebbistatin (bleb) or cytochalasin D (CytoD). Mean values were normalized to the vehicle condition. Error bars: SEM. (n=61–163 cilia). (B) Hedgehog-dependent removal of GPR161 is predicted to lower ciliary cAMP levels. In retrieval mutants, GPR161 is removed by ectocytosis still permitting a partial reduction in ciliary cAMP. Simultaneous blockage of retrieval and ectocytosis release is predicted to keep ciliary cAMP levels constant irrespective of Hedgehog pathway activation. (C–H) Retrieval and ectocytosis ensure appropriate Gli3 processing. Wild-type or Ift27−/− (C–E) IMCD3 or (F–H) MEF cells were starved for 24 h, and then treated with vehicle or SAG and either DMSO or the Drebrin inhibitor BTP2 for 8 h. (C and F) show Western blots for Gli3R (see Fig. S7B–C for full blot). (D and G) plot ratios of Gli3R to Gli3FL from representative experiments. (E and H) report the Gli3 processing index from 3 biological replicates. The Gli3 processing index is the fractional change of the Gli3R:Gli3FL ratio upon SAG treatment (Gli3R:Gli3FLSAG/Gli3R:Gli3FLvehicle). Error bars: SD.

References

    1. Barlowe C, Helenius A. Cargo Capture and Bulk Flow in the Early Secretory Pathway. Annu Rev Cell Dev Biol. 2016;32:197–222. - PubMed
    1. Bartheld Von CS, Altick AL. Multivesicular bodies in neurons: distribution, protein content, and trafficking functions. Prog. Neurobiol. 2011;93:313–340. - PMC - PubMed
    1. Berbari NF, Lewis JS, Bishop GA, Askwith CC, Mykytyn K. Bardet-Biedl syndrome proteins are required for the localization of G protein-coupled receptors to primary cilia. Proc Natl Acad Sci USA. 2008;105:4242–4246. - PMC - PubMed
    1. Breslow D, Koslover EF, Seydel F, Spakowitz AJ, Nachury MV. An in vitro assay for entry into cilia reveals unique properties of the soluble diffusion barrier. J Cell Biol. 2013;203:129–147. - PMC - PubMed
    1. Buss F, Kendrick-Jones J, Lionne C, Knight AE, Côté GP, Paul Luzio J. The localization of myosin VI at the golgi complex and leading edge of fibroblasts and its phosphorylation and recruitment into membrane ruffles of A431 cells after growth factor stimulation. J Cell Biol. 1998;143:1535–1545. - PMC - PubMed

LinkOut - more resources