

Less Hidden Celiac Disease But Increased Gluten Avoidance Without a Diagnosis in the United States: Findings From the National Health and Nutrition Examination Surveys From 2009 to 2014
- PMID: 28017411
- PMCID: PMC5459670
- DOI: 10.1016/j.mayocp.2016.10.012
Less Hidden Celiac Disease But Increased Gluten Avoidance Without a Diagnosis in the United States: Findings From the National Health and Nutrition Examination Surveys From 2009 to 2014
Abstract
Objective: To investigate the trends in the prevalence of diagnosed celiac disease (CD), undiagnosed CD, and people without celiac disease avoiding gluten (PWAG) in the civilian noninstitutionalized US population from 2009 to 2014.
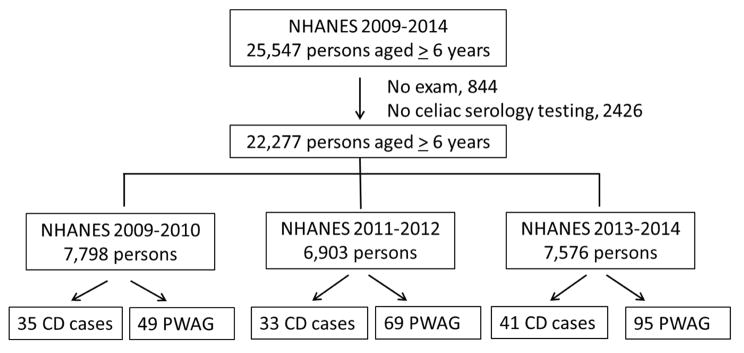
Patients and methods: We studied the occurrence of CD and PWAG in the 2009 to 2014 National Health and Nutrition Examination Surveys. The serum of all participants aged 6 years or older from the National Health and Nutrition Examination Surveys from 2009 to 2014 was tested for CD serology at Mayo Clinic. Participants were interviewed for a diagnosis of CD and the use of a gluten-free diet (GFD). The design effects of the survey and sample weights were incorporated in all statistical analyses.
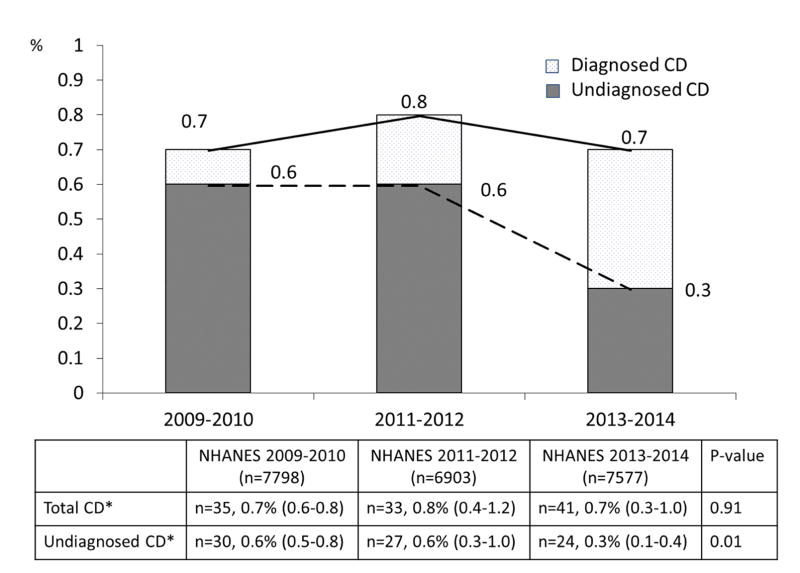
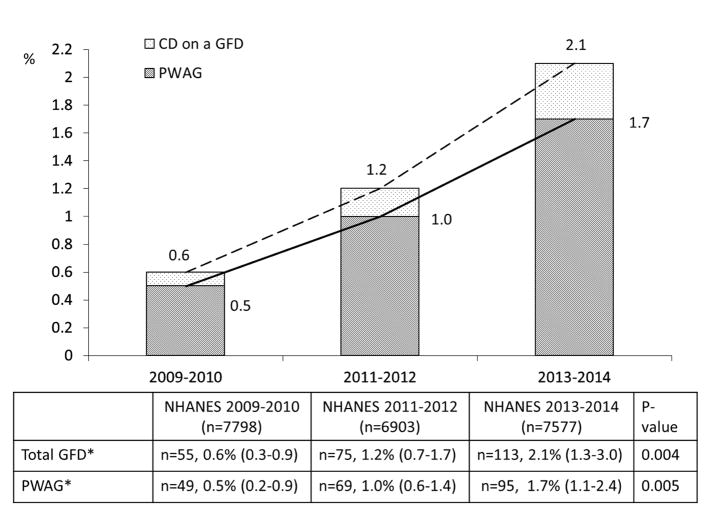
Results: In the US general population, the prevalence of CD did not change significantly from 0.7% (95% CI, 0.6%-0.8%) in 2009 to 2010 to 0.8% (95% CI, 0.4%-1.2%) in 2011 to 2012 to 0.7% (95% CI, 0.3%-1.0%) in 2013 to 2014. However, the prevalence of undiagnosed CD decreased from 0.6% in 2009 to 2010 to 0.3% in 2013 to 2014. In contrast, the prevalence of PWAG increased significantly from 0.5% (95% CI, 0.2%-0.9%) in 2009 to 2010 to 1.0% (95% CI, 0.6%-1.4%) in 2011 to 2012 to 1.7% (95% CI, 1.1%-2.4%) in 2013 to 2014 (P=.005 for trend).
Conclusion: Although the overall prevalence of CD remained stable from 2009 to 2014, the proportion of individuals with CD that is hidden considerably decreased. Moreover, the proportion of individuals without CD but following a GFD increased markedly from 2009 to 2014. Long-term health consequences of a GFD warrant further investigation.
Copyright © 2016 Mayo Foundation for Medical Education and Research. All rights reserved.
Conflict of interest statement
Figures

References
-
- Fasano A, Berti I, Gerarduzzi T, et al. Prevalence of celiac disease in at-risk and not-at-risk groups in the United States: a large multicenter study. Arch Intern Med. 2003;163(3):286–292. - PubMed
-
- Choung RS, Ditah IC, Nadeau AM, et al. Trends and racial/ethnic disparities in gluten-sensitive problems in the United States: findings from the National Health and Nutrition Examination Surveys from 1988 to 2012. Am J Gastroenterol. 2015;110(3):455–461. - PubMed
-
- Kang JY, Kang AH, Green A, Gwee KA, Ho KY. Systematic review: worldwide variation in the frequency of coeliac disease and changes over time. Aliment Pharmacol Ther. 2013;38(3):226–245. - PubMed
Grants and funding
LinkOut - more resources
Full Text Sources
Other Literature Sources
Medical
