

Spread of yellow fever virus outbreak in Angola and the Democratic Republic of the Congo 2015-16: a modelling study
- PMID: 28017559
- PMCID: PMC5332542
- DOI: 10.1016/S1473-3099(16)30513-8
Spread of yellow fever virus outbreak in Angola and the Democratic Republic of the Congo 2015-16: a modelling study
Erratum in
-
Correction to Lancet Infect Dis 2017; 17: 330-38.Lancet Infect Dis. 2019 Apr;19(4):e109. doi: 10.1016/S1473-3099(19)30079-9. Epub 2019 Feb 15. Lancet Infect Dis. 2019. PMID: 30777647 Free PMC article. No abstract available.
Abstract
Background: Since late 2015, an epidemic of yellow fever has caused more than 7334 suspected cases in Angola and the Democratic Republic of the Congo, including 393 deaths. We sought to understand the spatial spread of this outbreak to optimise the use of the limited available vaccine stock.
Methods: We jointly analysed datasets describing the epidemic of yellow fever, vector suitability, human demography, and mobility in central Africa to understand and predict the spread of yellow fever virus. We used a standard logistic model to infer the district-specific yellow fever virus infection risk during the course of the epidemic in the region.
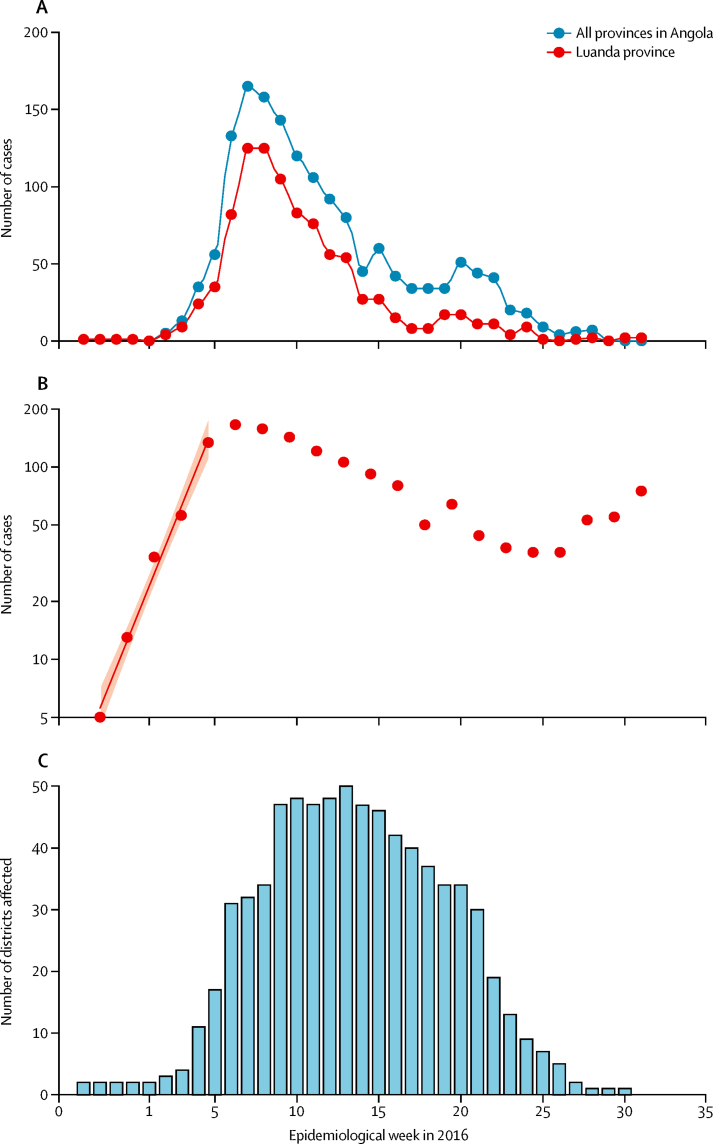
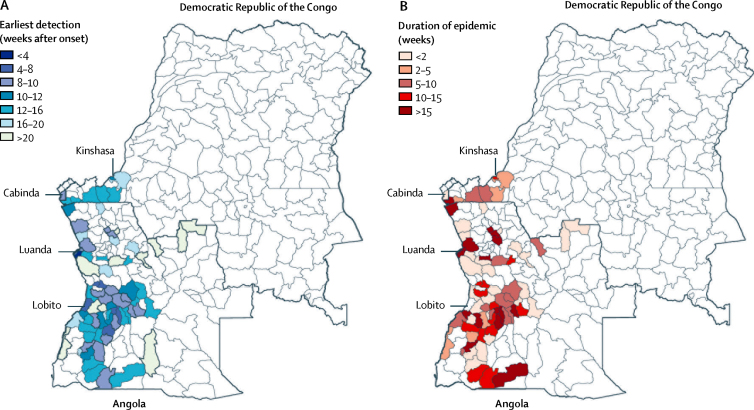
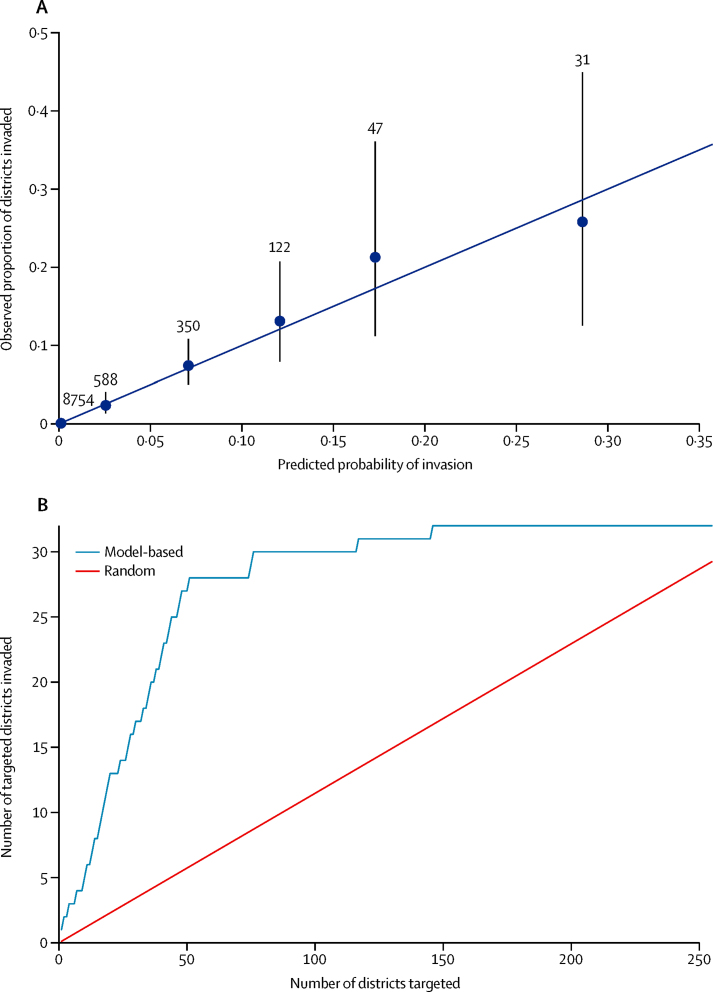
Findings: The early spread of yellow fever virus was characterised by fast exponential growth (doubling time of 5-7 days) and fast spatial expansion (49 districts reported cases after only 3 months) from Luanda, the capital of Angola. Early invasion was positively correlated with high population density (Pearson's r 0·52, 95% CI 0·34-0·66). The further away locations were from Luanda, the later the date of invasion (Pearson's r 0·60, 95% CI 0·52-0·66). In a Cox model, we noted that districts with higher population densities also had higher risks of sustained transmission (the hazard ratio for cases ceasing was 0·74, 95% CI 0·13-0·92 per log-unit increase in the population size of a district). A model that captured human mobility and vector suitability successfully discriminated districts with high risk of invasion from others with a lower risk (area under the curve 0·94, 95% CI 0·92-0·97). If at the start of the epidemic, sufficient vaccines had been available to target 50 out of 313 districts in the area, our model would have correctly identified 27 (84%) of the 32 districts that were eventually affected.
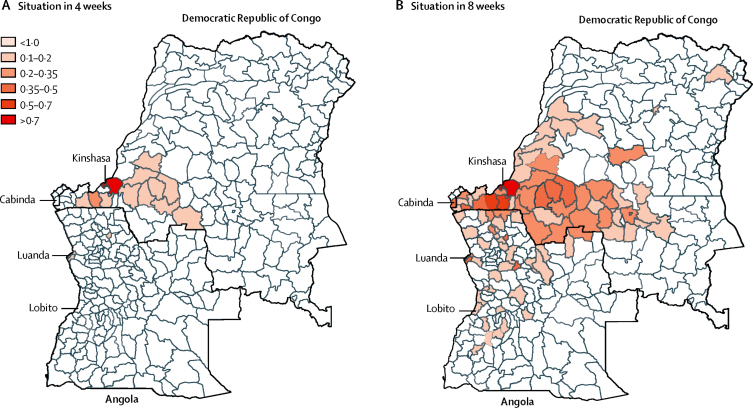
Interpretation: Our findings show the contributions of ecological and demographic factors to the ongoing spread of the yellow fever outbreak and provide estimates of the areas that could be prioritised for vaccination, although other constraints such as vaccine supply and delivery need to be accounted for before such insights can be translated into policy.
Funding: Wellcome Trust.
Copyright © 2017 The Author(s). Published by Elsevier Ltd. This is an Open Access article under the CC BY license. Published by Elsevier Ltd.. All rights reserved.
Figures
Comment in
-
Responding to the threat of urban yellow fever outbreaks.Lancet Infect Dis. 2017 Mar;17(3):248-250. doi: 10.1016/S1473-3099(16)30588-6. Epub 2016 Dec 23. Lancet Infect Dis. 2017. PMID: 28017560 No abstract available.
References
-
- Monath TP. Yellow fever: an update. Lancet Infect Dis. 2001;1:11–20. - PubMed
-
- Barrett ADT. Yellow fever in Angola and beyond—the problem of vaccine supply and demand. N Engl J Med. 2016;375:301–303. - PubMed
-
- Ellis BR, Barrett ADT. The enigma of yellow fever in East Africa. Rev Med Virol. 2008;18:331–346. - PubMed
-
- Barrett ADT, Higgs S. Yellow fever: a disease that has yet to be conquered. Annu Rev Entomol. 2007;52:209–229. - PubMed
-
- Monath TP, Vasconcelos PFC. Yellow fever. J Clin Virol. 2015;64:160–173. - PubMed
Publication types
MeSH terms
Grants and funding
LinkOut - more resources
Full Text Sources
Other Literature Sources
