. 2017 Jan 9;31(1):127-141.
doi: 10.1016/j.ccell.2016.11.017. Epub 2016 Dec 22.

FTO Plays an Oncogenic Role in Acute Myeloid Leukemia as a N6-Methyladenosine RNA Demethylase

Affiliations

FTO Plays an Oncogenic Role in Acute Myeloid Leukemia as a N6-Methyladenosine RNA Demethylase

Zejuan Li et al. Cancer Cell. .

Abstract

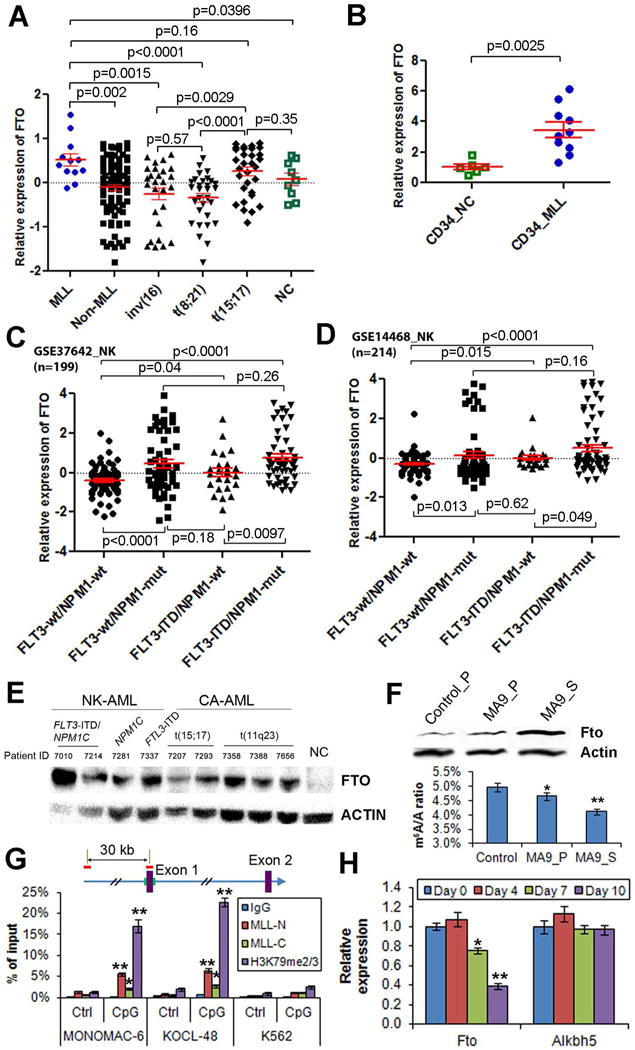
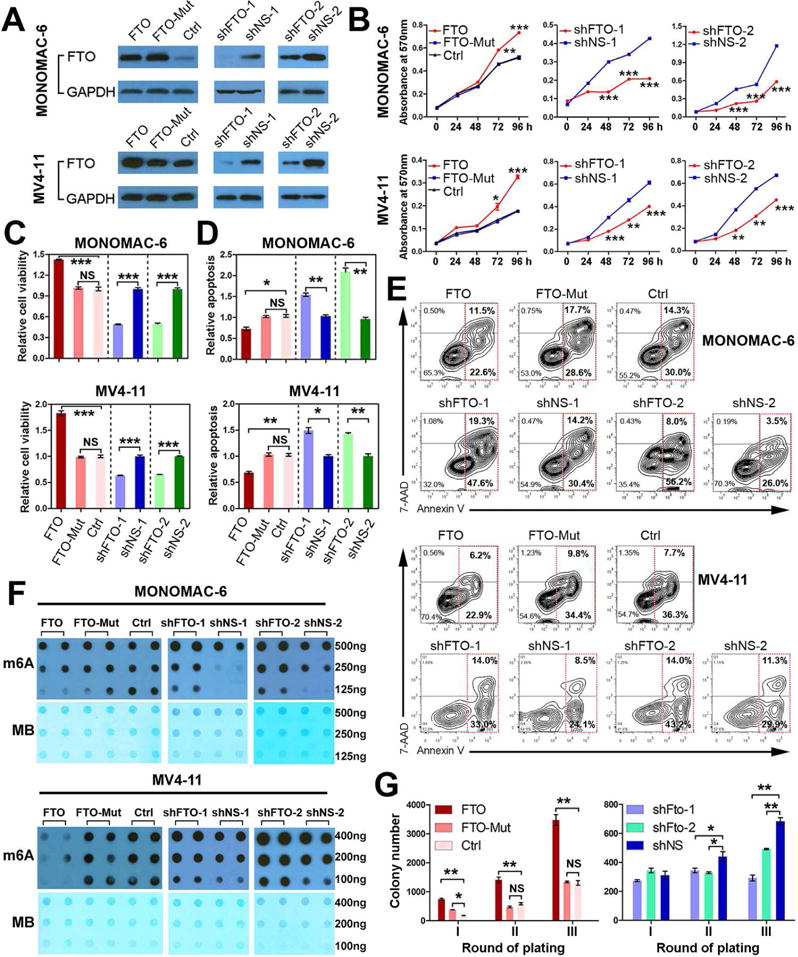
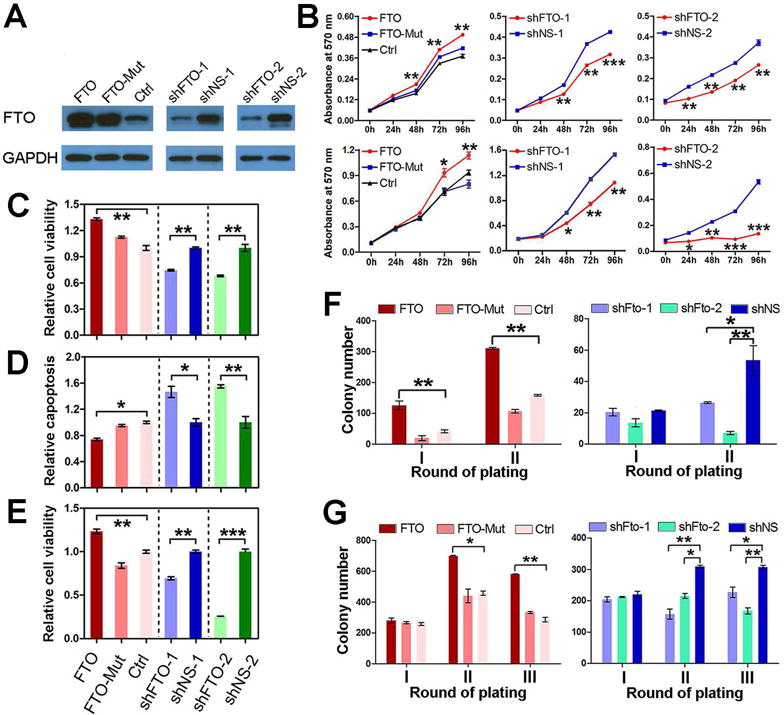
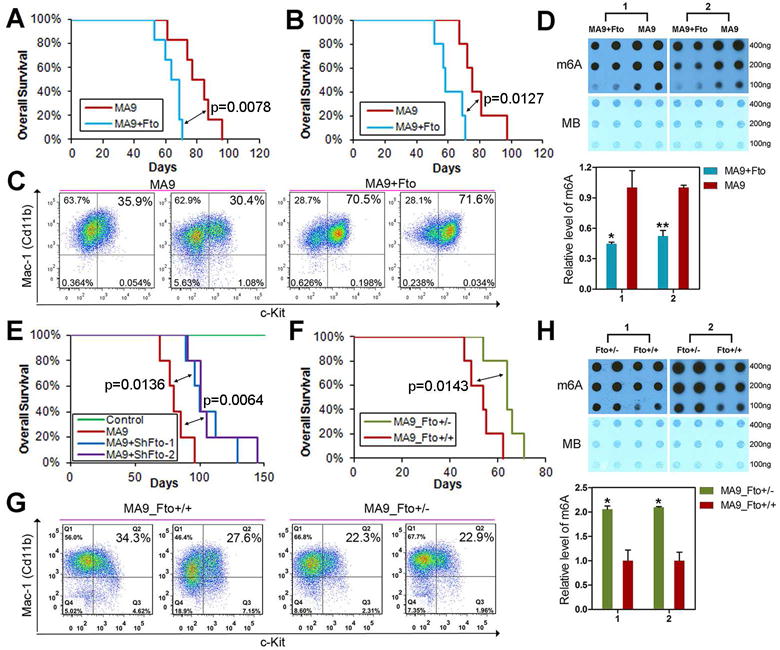
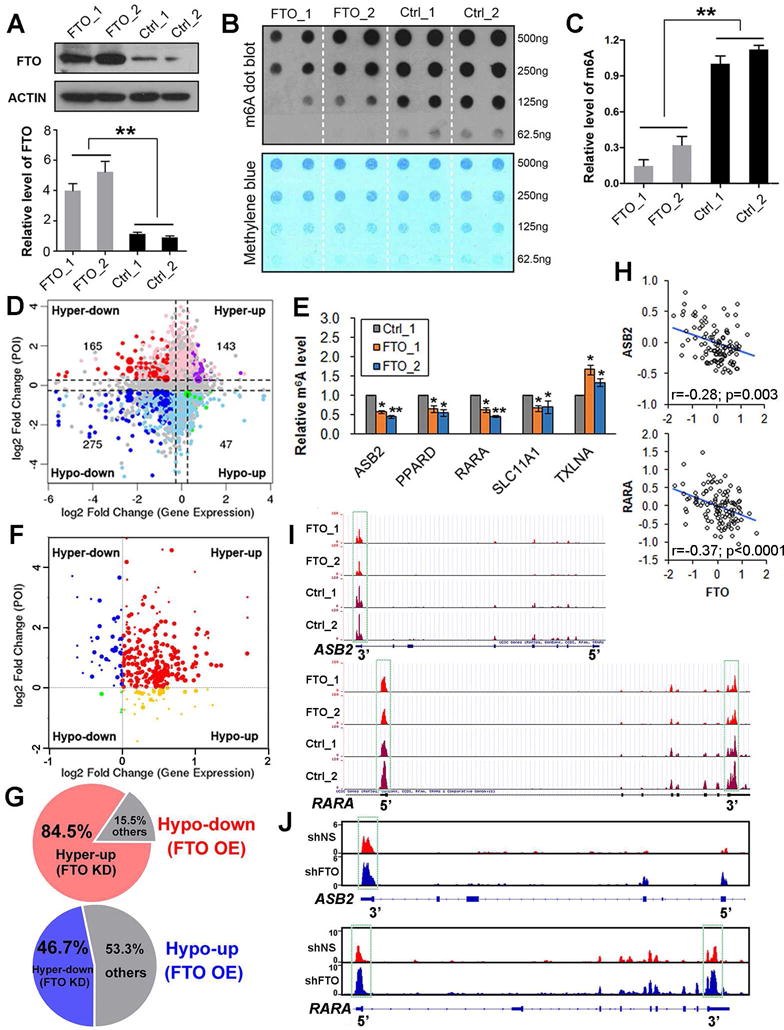
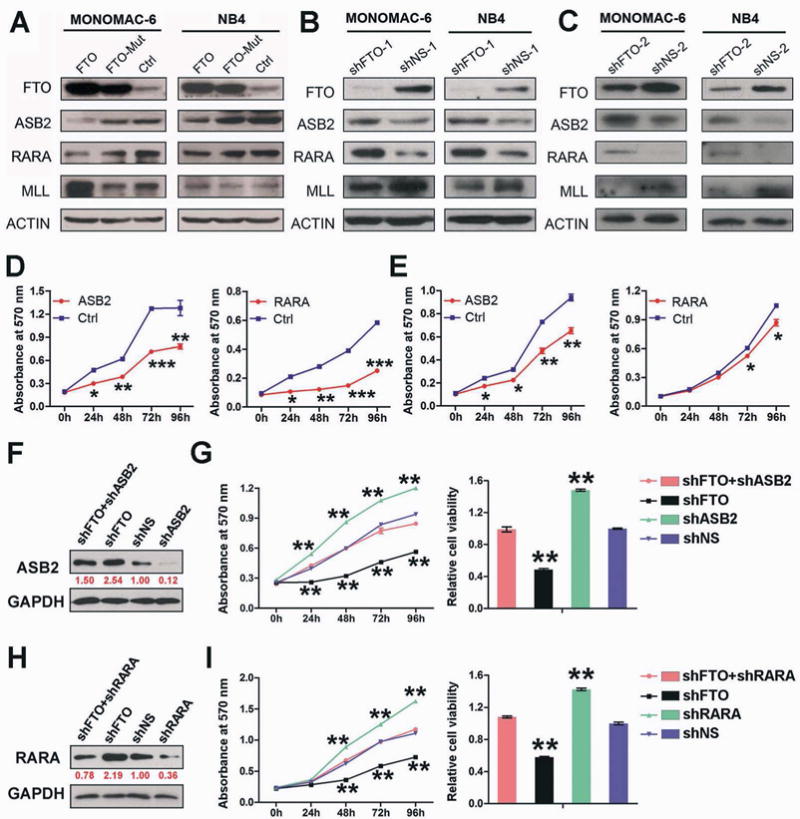
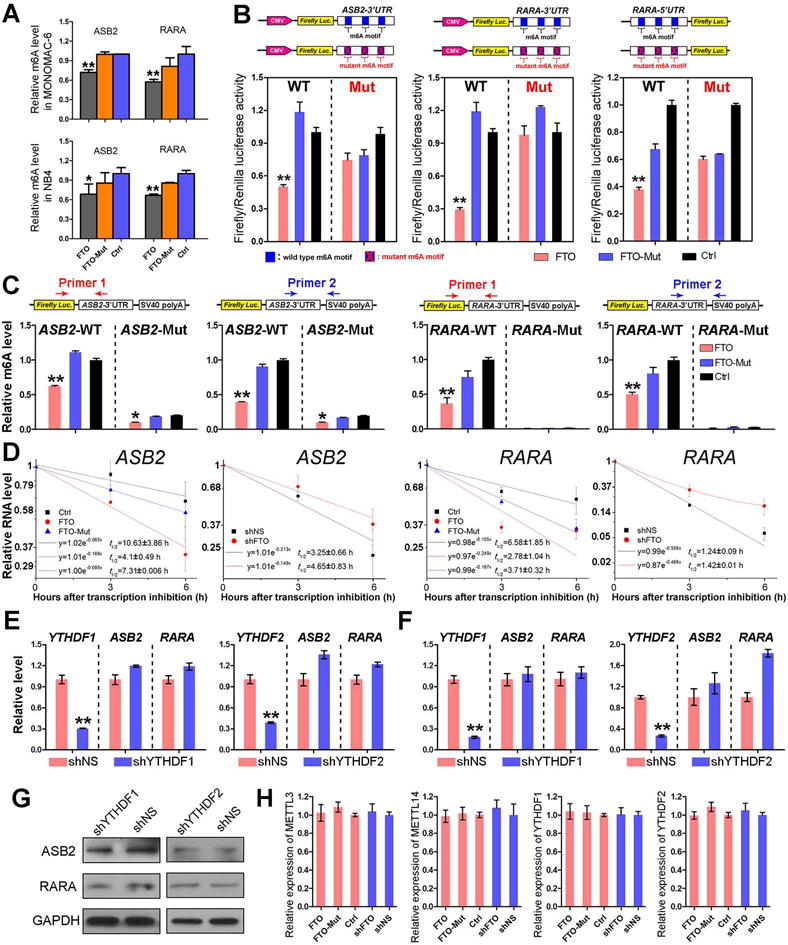
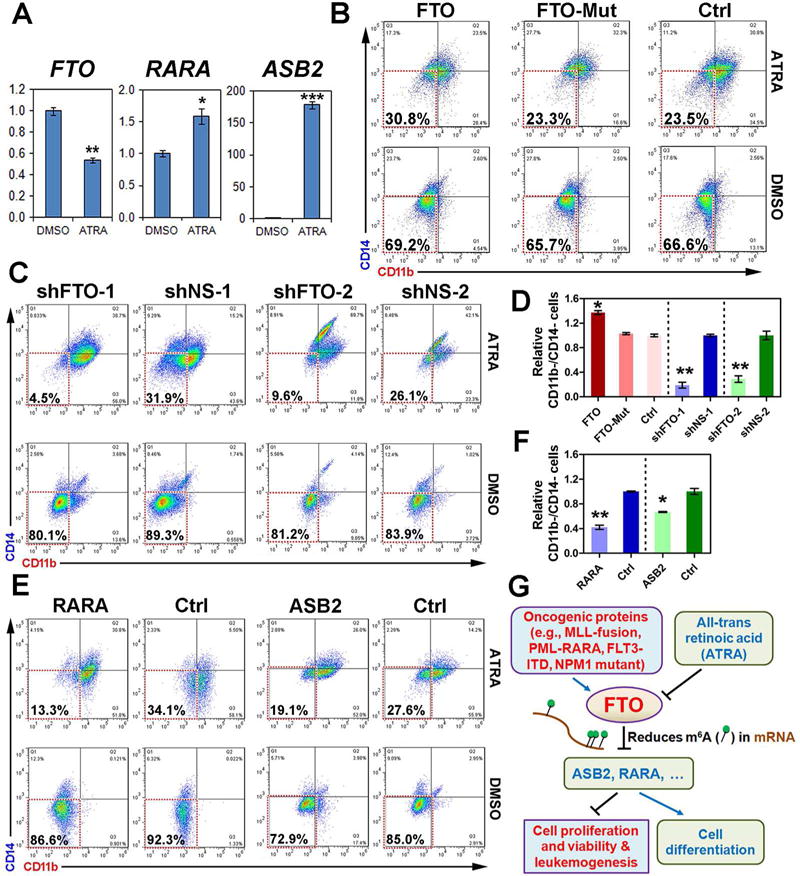
N6-Methyladenosine (m6A) represents the most prevalent internal modification in mammalian mRNAs. Despite its functional importance in various fundamental bioprocesses, the studies of m6A in cancer have been limited. Here we show that FTO, as an m6A demethylase, plays a critical oncogenic role in acute myeloid leukemia (AML). FTO is highly expressed in AMLs with t(11q23)/MLL rearrangements, t(15;17)/PML-RARA, FLT3-ITD, and/or NPM1 mutations. FTO enhances leukemic oncogene-mediated cell transformation and leukemogenesis, and inhibits all-trans-retinoic acid (ATRA)-induced AML cell differentiation, through regulating expression of targets such as ASB2 and RARA by reducing m6A levels in these mRNA transcripts. Collectively, our study demonstrates the functional importance of the m6A methylation and the corresponding proteins in cancer, and provides profound insights into leukemogenesis and drug response.

Keywords: AML; ASB2; ATRA; FTO; RARA; RNA modification; RNA stability; cell differentiation; leukemogenesis; m6A.


Conflict of interest statement

The authors declare no competing financial interests.

Figures

Figure 1
Figure 1. FTO is highly expressed in certain AML subtypes
(A) Comparison of FTO expression between human primary AML cases with MLL rearrangements/t(11q23) (MLL) and those without MLL rearrangements (non-MLL), or AML cases with inv(16), t(8;21) or t(15;17), or normal controls (NC). The expression values were detected by Affymetrix exon arrays (Huang et al., 2013). The expression values were log2-transformed and mean centered. (B) qPCR analysis of FTO expression in human CD34+ AML BM cells isolated from 10 primary MLL-rearranged AML patients (CD34_MLL) and normal CD34+ BM cells isolated from 6 healthy donors (CD34_NC). The average expression level of FTO in the CD34_NC samples was set as 1. (C,D) The expression patterns of FTO across cytogenetically normal (or normal karyotype; NK) AMLs within GSE37642 set (n=562) and GSE14468 set (n=518) AML datasets. (E) Western blot assay of FTO expression in human primary AML specimens with different fusion genes or mutant oncogenes and a healthy donor sample (NC). Mononuclear cells isolated from primary AML patients and the healthy donor were used for the assay. (F) The protein level of Fto (upper panel) and m6A level (lower panel; by QQQ-MS) in the representative samples of the control group (from a primary BMT recipient) or MA9 leukemic group (one each from primary and secondary BMT recipients). (G) ChIP-qPCR assays of the enrichment of MLL-N (i.e., MLL N-terminal, representing both wild-type MLL and MLL-fusion proteins), MLL-C (i.e., MLL C-terminal, representing wild-type MLL only), and H3K79me2/3 at the promoter region of FTO (CpG site) and a distal upstream region (Control site) in MONOMAC-6, KOCL-48 and K562 cells. IgG was used as a negative control. (H) qPCR analysis of Fto and Alkbh5 expression in mouse MLL-ENL-ERtm cells after withdrawal of 4-OHT. *, p<0.05; **, p<0.01; t-test. See also Figure S1.
Figure 2
Figure 2. Biological effects of forced expression or knockdown of FTO/Fto expression in MLL-rearranged AML
(A) Western Blotting confirmation of forced expression and knockdown of FTO by lentiviral constructs in MONOMAC-6 and MV4-11 cells. FTO, pMIRNA1-FTO; FTO-Mut, pMIRNA1-FTO-Mut; Ctrl, control vector (empty pMIRNA1); shFTO-1, pLKO.1-shFTO-1; shNS-1, pLKO.1-shNS-1; shFTO-2, pGFP-C-shLenti-shFTO-2; shNS-2, pGFP-C-shLenti-shNS-2. (B–E) Effects of forced expression or knockdown of FTO expression on cell growth/proliferation (B), viability (C,D), and apoptosis (E) in MONOMAC-6 and MV4-11 cells. h, hour. (F) m6A dot blot assays of MONOMAC-6 and MV4-11 cells with or without forced expression or knockdown of FTO. MB, methylene blue staining (as loading control). (G) Effects of forced expression of FTO or FTO-Mut (with the above pMIRNA1 constructs) or knockdown of Fto expression (with pGFP-V-RS-Fto shRNAs) on colony-forming/replating capacity of mouse normal BM progenitor cells transduced by MSCVneo-MLL-AF9 (MA9). Colony cells were replated every 7 days. *, p<0.05; **, p<0.01; ***, p<0.001; NS, not significant (p>0.05); t-test. See also Figure S2.
Figure 3
Figure 3. Effects of forced expression or knockdown of FTO/Fto in PML-RARA and FLT3-ITD/NPM1-mutant AML
(A) Confirmation of overexpression and knockdown of FTO by Western blotting in PL-21/t(15;17) AML cells. (B) Effects of forced expression or knockdown of FTO expression on cell growth/proliferation in PL-21 (upper panels) and NB4/t(15;17) (lower panels) AML cells. (C–E) Effects of forced expression or knockdown of FTO expression on cell viability in PL-21 (C) and NB4 (E), and apoptosis in PL-21 (D) cells. (F, G) Effects of forced expression of FTO or FTO-Mut, and knockdown of Fto expression on colony-forming/replating capacity of mouse BM progenitor cells carrying PML-RARA (F) or FLT3-ITD/NPM1-mutant (G). Colony cells were replated every 7 days. *, p<0.05; **, p<0.01; ***, p<0.001. See also Figure S3.
Figure 4
Figure 4. The role of Fto in leukemogenesis mediated by MLL-AF9
(A,B) Effect of forced expression of Fto on MLL-AF9 (MA9)-induced leukemogenesis. Kaplan-Meier curves are shown for two cohorts of transplanted mice including MSCVneo-MA9+MSCV-PIG (MA9) and MSCVneo-MA9+MSCV-PIG-Fto (MA9+Fto) from two independent BM transplantation (BMT) assays. Six mice per group in plot A and 5 mice per group in plot B. The p values were calculated by log-rank test. (C,D) Flow cytometry analysis of Mac-1+ and c-Kit+ cell populations (C) and m6A dot blot analysis (D) in BM cells of the representative leukemic mice from the BMT assay shown in Figure 4A. (E) Effect of depleted expression of Fto by shRNAs on MA9-induced leukemogenesis. Kaplan-Meier curves are shown for four cohorts of transplanted mice including MSCVneo+MSCV-PIG (Control), MSCVneo-MA9+MSCV-PIG (MA9), MSCVneo-MA9+pGFP-V-RS-shFto-1 (MA9+shFto-1) and MSCVneo-MA9+pGFP-V-RS-shFto-2 (MA9+shFto-2). Five mice were studied per group. (F) Effect of depleted expression of Fto by genetic knockout (heterozygous) on MA9-induced leukemogenesis. Kaplan-Meier curves are shown for two cohorts of recipient mice transplanted with MSCVneo-MA9 transduced wild-type donor cells (MA9_Fto+/+) and MSCVneo-MLL-AF9 transduced Fto+/− donor cells (MA9_Fto+/−). Five mice were studied per group. (G, H) Flow cytometry analysis of Mac-1+ and c-Kit+ cell populations (G) and m6A dot blot analysis (H) in BM cells of the representative leukemic mice from the BMT assay shown in Figure 4F. *, p<0.05; **, p<0.01; t-test. See also Figure S4.
Figure 5
Figure 5. Identification of potential targets of FTO in AML via transcriptome-wide m6A-seq and RNA-seq assays
(A) Western blot assay of FTO expression in human MONOMAC-6 AML cell lines with or without forced expression of FTO, including FTO_1/2 and Ctrl_1/2 cell lines. Upper panel shows the image and the lower panel shows the relative quantitative information of FTO expression at the protein level in different AML cell lines. (B,C) The m6A dot blot assay (B) and relative quantitative information (C) of global m6A abundance in transcriptomes of the above four cell lines. (D) Distribution of genes with a significant change in both m6A level and overall transcript (i.e., expression) level in FTO-overexpressing (FTO_1 and FTO_2) compared to control (Ctrl_1 and Ctrl_2) MONOMAC-6 AML cells. (E) Gene-specific m6A qPCR validation of m6A level changes of five representative m6A-Hypo genes in MONOMAC-6 cells. (F) Distribution of the FTO-induced hypo-genes (including the hypo-down and hypo-up groups shown in Figure 5D) in FTO-knockdown MA9/FLT3-ITD AML cells relative to the control AML cells. (G) Up to 84.5% Hypo-down genes in FTO-overexpressing (FTO OE) MONOMAC-6 AML cells display Hyper-up pattern in FTO knockdown (FTO KD) MA9/FLT3-ITD AML cells; 46.7% Hypo-up genes in the FTO OE cells display Hyper-down pattern in the FTO KD cells. (H) Correlation of expression between FTO and ASB2 or RARA across the 109 (100 AML and 9 normal control) samples shown in Figure 1A. (I, J) The m6A abundances in ASB2 and RARA mRNA transcripts in FTO-overexpressing (FTO_1 and FTO_2) and control (Ctrl_1 and Ctrl_2) MONOMAC-6 AML cells (I), and in FTO-knockdown (shFTO-1) and control (shNS) MA9/FLT3-ITD AML cells (J), as detected by m6A-seq. The m6A peaks shown in the green rectangles are those have a significant reduced abundance (p<0.005; fold change>1.2) in FTO_1/2 than in Ctrl_1/2 cells. *, p<0.05; **, p<0.01; t-test. See also Figure S5 and Tables S1–3.
Figure 6
Figure 6. ASB2 and RARA are two critical target genes of FTO in AML
(A–C) Western blot assays of FTO, ASB2, RARA and MLL in MONOMAC-6 or NB4 AML cells with lentivirally transduced FTO (pmiRNA1-FTO), FTO mutant (H231A and D233A; pmiRNA1-FTO-Mut) or control (Ctrl; pmiRNA1) construct (A), as well as shFTO-1/shNS-1 (B) and shFTO-2/shNS-2 (C). ACTIN was used as the endogenous control protein for loading control. (D, E) Effects of forced expression of ASB2 and RARA on cell growth/proliferation in MONOMAC-6 (D) and NB4 (E) AML cells. (F) Western blot assays of ASB2 in MONOMAC-6 cells transduced with shFTO+shASB2 (pLKO.1-shFTO-1+ pTRIPZ-shASB2), shFTO (pLKO.1-shFTO-1 + pTRIPZ), shNS (pLKO.1-shNS + pTRIPZ) or shASB2 (pLKO.1-shNS-1 + pTRIPZ-shASB2). (G) Effects of FTO and/or ASB2 knockdown on cell growth/proliferation (left panel) and viability (right panel) in MONOMAC-6 cells. (H) Western blot assays of RARA in MONOMAC-6 AML cells transduced with shFTO+shRARA (pLKO.1-shFTO-1+ shRARA), shFTO (pLKO.1-shFTO-1+ shNS), shNS (pLKO.1-shNS + shNS) or shRARA (pLKO.1-shNS-1 + shRARA). (I) Effects of FTO and/or RARA knockdown on cell growth/proliferation (left panel) and viability (right panel) in MONOMAC-6 cells. *, p<0.05; **, p<0.01; ***, p<0.001; t-test. See also Figure S6.
Figure 7
Figure 7. FTO-mediated regulation of expression of ASB2 and RARA relies on its m6A demethylase activity and the m6A modifications in target mRNAs
(A) Gene-specific m6A qPCR analysis of m6A level in mRNA transcripts of each gene in MONOMAC-6 and NB4 cells transduced with FTO (FTO), FTO mutant (FTO-Mut) or control vector (Ctrl). (B) Relative luciferase activity of pMIR-REPORT-ASB2-3′UTR (left panel), pMIR-REPORT-RARA-3′UTR (middle panel) and pGL3-basic-RARA-5′UTR (right panel) with either wild-type or mutant (A-to-T mutation) m6A sites after co-transfection with FTO (FTO), FTO mutant (FTO-Mut) or control vector (Ctrl) into HEK-293T cell. Firefly luciferase activity was measured and normalized to Renilla luciferase activity. (C) Luciferase reporter assay related gene-specific m6A qPCR analysis of m6A levels in exogenous mRNA transcripts of Firefly Luc-ASB2 3′UTR or Firefly Luc-RARA 3′UTR in HEK-293T cells. For each luciferase reporter construct, we designed two different pairs of primers crossing the inserted ASB2 or RARA 3′UTR fragment and pMIR-Report vector fragment. Primer 1 covers the joint of Firefly Luc and ASB2-3′UTR or RARA-3′UTR. Primer 2 covers the joint of ASB2-3′UTR or RARA-3′UTR and SV40 poly A. (D) The mRNA half-life (t1/2) of ASB2 or RARA in NB4 cells transduced with FTO (FTO), FTO mutant (FTO-Mut) or control vector (Ctrl), or with depleted expression of FTO (shFTO-1) or not (shNS-1). (E, F) Relative expression of ASB2 and RARA after knockdown of m6A readers, YTHDF1 or YTHDF2, in MONOMAC-6 (E) and NB4 (F) cells. (G) Western blot assay of ASB2 and RARA expression after depletion of m6A readers in MONOMAC-6 cells. (H) Relative expression of m6A writers and readers with forced or depleted expression of FTO in MONOMAC-6 cells. *, p<0.05; **, p<0.01; t-test. See also Figure S7.
Figure 8
Figure 8. The potential role of the FTO⊣RARA/ASB2 axis in ATRA-induced NB4 cell differentiation and a schematic model of FTO signaling in AML
(A) Expressional changes of FTO, RARA, and ASB2 in NB4 cells 48 hours post treatment with 100 nM ATRA as detected by qPCR. *, p<0.05; **, p<0.01; ***, p<0.001; t-test. (B) Flow cytometric analyses of NB4 cells transduced with FTO (FTO), FTO mutant (FTO-Mut) or control vector (Ctrl) 48 hours post treatment with 500 nM ATRA or DMSO. (C) Flow cytometric analyses of NB4 cells with knockdown of FTO (shFTO-1 or shFTO-2) 48 hours post treatment with 100 nM ATRA or DMSO. (D) The summary of results from three independent experiments with those shown in Figure 8B or 8C as representatives. (E, F) The representative (E) or summary (F; from triplicates) results of flow cytometric analyses of NB4 cells with forced expression of RARA or ASB2 after exposed to 100 nM ATRA or DMSO for 48 hours. (G) The schematic model of the role and underlying mechanism of FTO in leukemogenesis and ATRA-induced differentiation of leukemic cells.

Comment in

References

    1. Alarcon CR, Lee H, Goodarzi H, Halberg N, Tavazoie SF. N6-methyladenosine marks primary microRNAs for processing. Nature. 2015;519:482–485. - PMC - PubMed
    1. Arteaga MF, Mikesch JH, Qiu J, Christensen J, Helin K, Kogan SC, Dong S, So CW. The histone demethylase PHF8 governs retinoic acid response in acute promyelocytic leukemia. Cancer Cell. 2013;23:376–389. - PMC - PubMed
    1. Ben-Haim MS, Moshitch-Moshkovitz S, Rechavi G. FTO: linking m6A demethylation to adipogenesis. Cell research. 2015;25:3–4. - PMC - PubMed
    1. Bernt KM, Zhu N, Sinha AU, Vempati S, Faber J, Krivtsov AV, Feng Z, Punt N, Daigle A, Bullinger L, et al. MLL-rearranged leukemia is dependent on aberrant H3K79 methylation by DOT1L. Cancer Cell. 2011;20:66–78. - PMC - PubMed
    1. Berulava T, Horsthemke B. The obesity-associated SNPs in intron 1 of the FTO gene affect primary transcript levels. Eur J Hum Genet. 2010;18:1054–1056. - PMC - PubMed

MeSH terms