

miR-263a Regulates ENaC to Maintain Osmotic and Intestinal Stem Cell Homeostasis in Drosophila
- PMID: 28017617
- PMCID: PMC5224988
- DOI: 10.1016/j.devcel.2016.11.023
miR-263a Regulates ENaC to Maintain Osmotic and Intestinal Stem Cell Homeostasis in Drosophila
Abstract
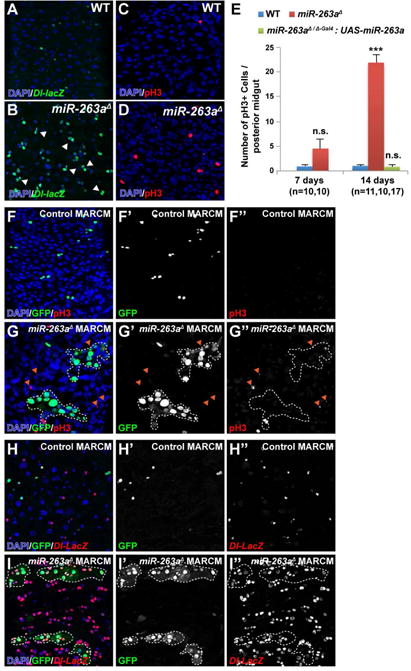
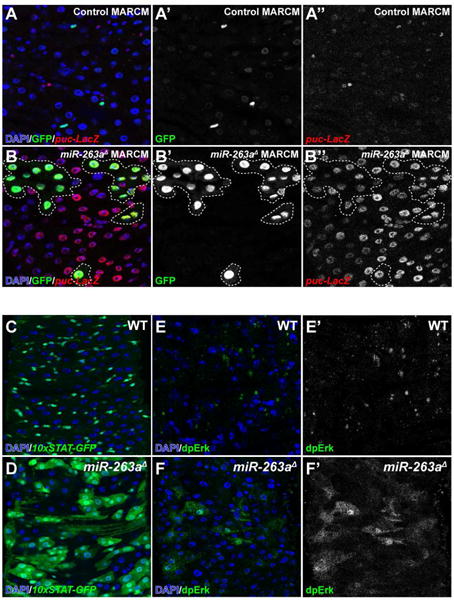
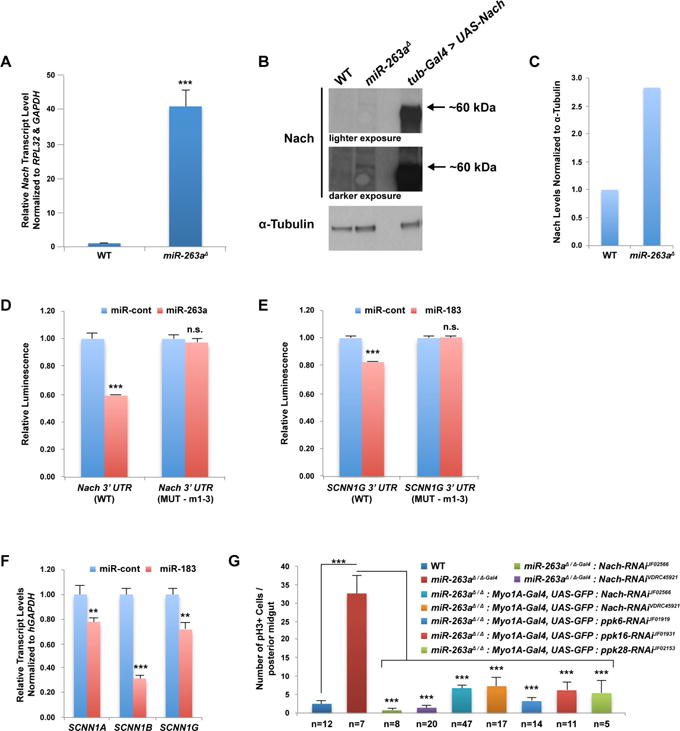
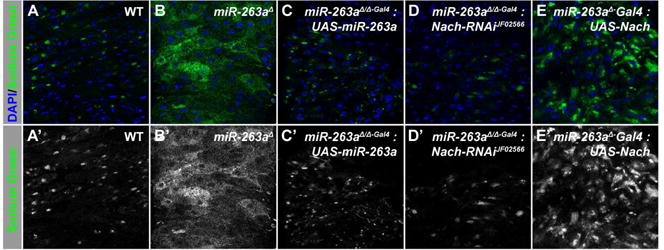
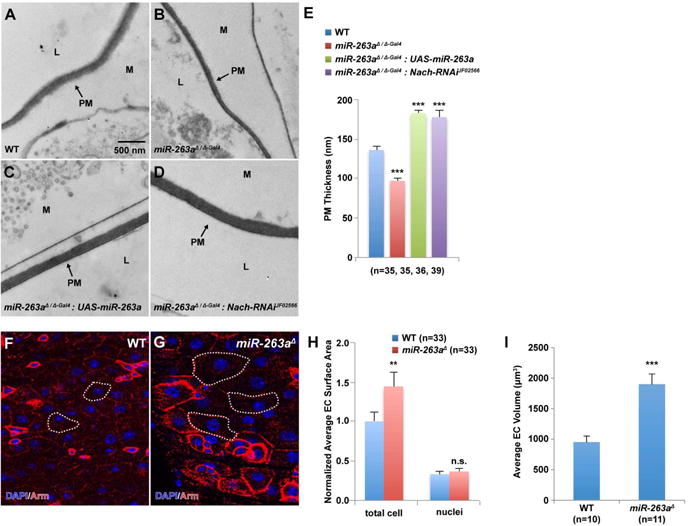
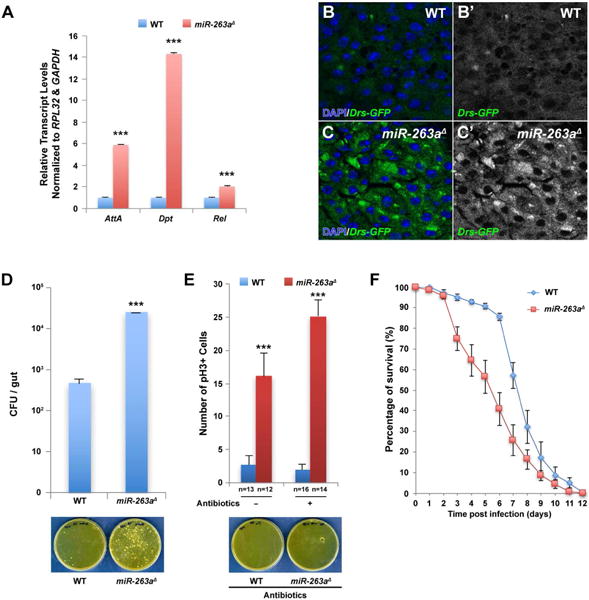
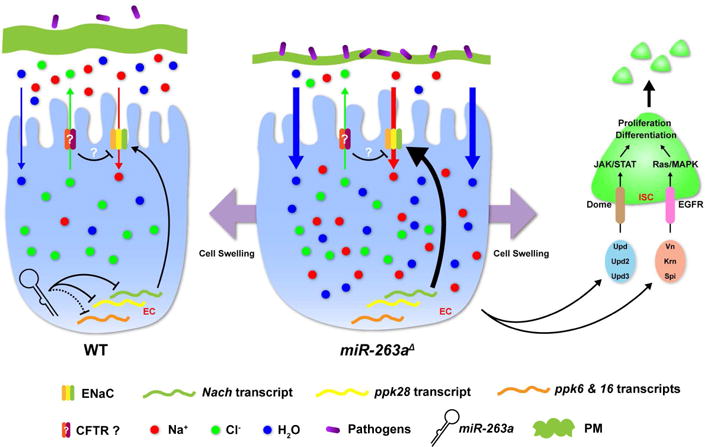
Proper regulation of osmotic balance and response to tissue damage is crucial in maintaining intestinal stem cell (ISC) homeostasis. We found that Drosophila miR-263a downregulates the expression of epithelial sodium channel (ENaC) subunits in enterocytes (ECs) to maintain osmotic and ISC homeostasis. In the absence of miR-263a, the intraluminal surface of the intestine displays dehydration-like phenotypes, Na+ levels are increased in ECs, stress pathways are activated in ECs, and ISCs overproliferate. Furthermore, miR-263a mutants have increased bacterial load and expression of antimicrobial peptides. Strikingly, these phenotypes are reminiscent of the pathophysiology of cystic fibrosis (CF) in which loss-of-function mutations in the chloride channel CF transmembrane conductance regulator can elevate the activity of ENaC, suggesting that Drosophila could be used as a model for CF. Finally, we provide evidence that overexpression of miR-183, the human ortholog of miR-263a, can also directly target the expressions of all three subunits of human ENaC.
Keywords: Drosophila; ENaC; cystic fibrosis; miR-183; miR-263a; microRNA.
Copyright © 2017 Elsevier Inc. All rights reserved.
Figures
Similar articles
-
ENaC is a host susceptibility factor to bacterial infections in cystic fibrosis context.Commun Biol. 2025 Apr 23;8(1):653. doi: 10.1038/s42003-025-07877-4. Commun Biol. 2025. PMID: 40269088 Free PMC article.
-
Paracrine Wingless signalling controls self-renewal of Drosophila intestinal stem cells.Nature. 2008 Oct 23;455(7216):1119-23. doi: 10.1038/nature07329. Epub 2008 Sep 21. Nature. 2008. PMID: 18806781
-
A stress-responsive miRNA regulates BMP signaling to maintain tissue homeostasis.Proc Natl Acad Sci U S A. 2021 May 25;118(21):e2022583118. doi: 10.1073/pnas.2022583118. Proc Natl Acad Sci U S A. 2021. PMID: 34016750 Free PMC article.
-
The epithelial sodium channel and the control of sodium balance.Biochim Biophys Acta. 2010 Dec;1802(12):1159-65. doi: 10.1016/j.bbadis.2010.06.014. Epub 2010 Jun 27. Biochim Biophys Acta. 2010. PMID: 20600867 Review.
-
Regulation of the Intestinal Stem Cell Pool and Proliferation in Drosophila.Cells. 2024 Nov 8;13(22):1856. doi: 10.3390/cells13221856. Cells. 2024. PMID: 39594605 Free PMC article. Review.
Cited by
-
Drosophila intestinal stem and progenitor cells are major sources and regulators of homeostatic niche signals.Proc Natl Acad Sci U S A. 2018 Nov 27;115(48):12218-12223. doi: 10.1073/pnas.1719169115. Epub 2018 Nov 7. Proc Natl Acad Sci U S A. 2018. PMID: 30404917 Free PMC article.
-
ENaC is a host susceptibility factor to bacterial infections in cystic fibrosis context.Commun Biol. 2025 Apr 23;8(1):653. doi: 10.1038/s42003-025-07877-4. Commun Biol. 2025. PMID: 40269088 Free PMC article.
-
Drosophila as a model for studying cystic fibrosis pathophysiology of the gastrointestinal system.Proc Natl Acad Sci U S A. 2020 May 12;117(19):10357-10367. doi: 10.1073/pnas.1913127117. Epub 2020 Apr 28. Proc Natl Acad Sci U S A. 2020. PMID: 32345720 Free PMC article.
-
Emerging microRNA Therapeutic Approaches for Cystic Fibrosis.Front Pharmacol. 2018 Oct 8;9:1113. doi: 10.3389/fphar.2018.01113. eCollection 2018. Front Pharmacol. 2018. PMID: 30349480 Free PMC article. Review.
-
Animal models of cystic fibrosis in the era of highly effective modulator therapies.Curr Opin Pharmacol. 2022 Jun;64:102235. doi: 10.1016/j.coph.2022.102235. Epub 2022 May 13. Curr Opin Pharmacol. 2022. PMID: 35576754 Free PMC article. Review.
References
-
- Amorino GP, Fox MH. Intracellular Na+ measurements using sodium green tetraacetate with flow cytometry. Cytometry. 1995;21:248–256. - PubMed
-
- Bach EA, Ekas LA, Ayala-Camargo A, Flaherty MS, Lee H, Perrimon N, Baeg GH. GFP reporters detect the activation of the Drosophila JAK/STAT pathway in vivo. Gene Expr Patterns. 2007;7:323–331. - PubMed
-
- Berl T, Siriwardana G, Ao L, Butterfield LM, Heasley LE. Multiple mitogen-activated protein kinases are regulated by hyperosmolality in mouse IMCD cells. Am J Physiol. 1997;272:F305–311. - PubMed
Publication types
MeSH terms
Substances
Grants and funding
LinkOut - more resources
Full Text Sources
Other Literature Sources
Medical
Molecular Biology Databases
