. 2017 May:38:63-70.
doi: 10.1016/j.mri.2016.12.018. Epub 2016 Dec 23.

A simple analytic method for estimating T2 in the knee from DESS

Affiliations

A simple analytic method for estimating T2 in the knee from DESS

B Sveinsson et al. Magn Reson Imaging. 2017 May.

Abstract

Purpose: To introduce a simple analytical formula for estimating T2 from a single Double-Echo in Steady-State (DESS) scan.

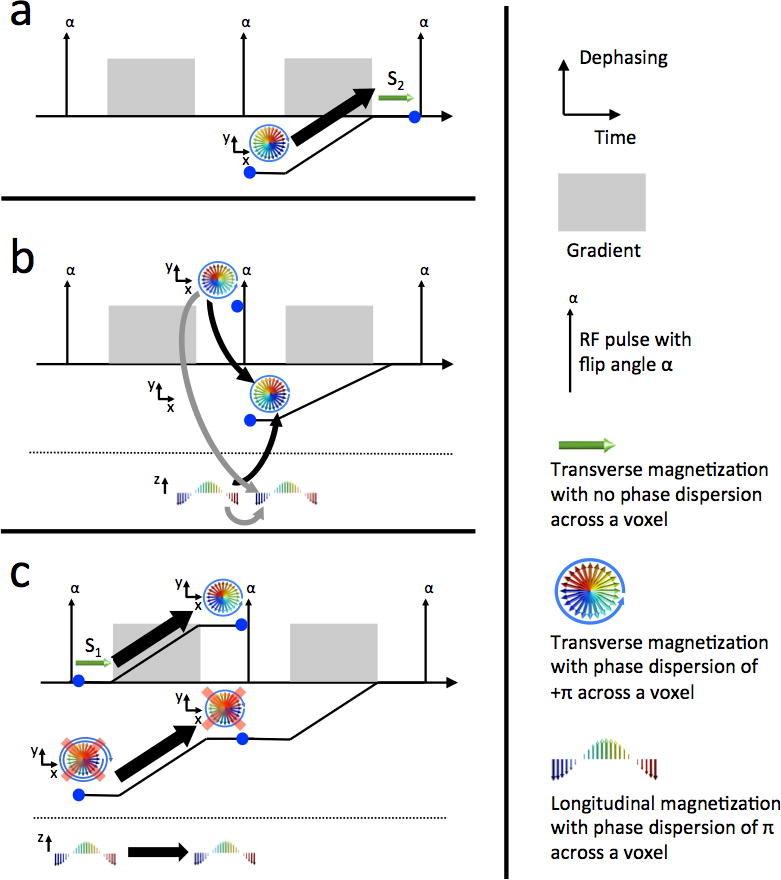
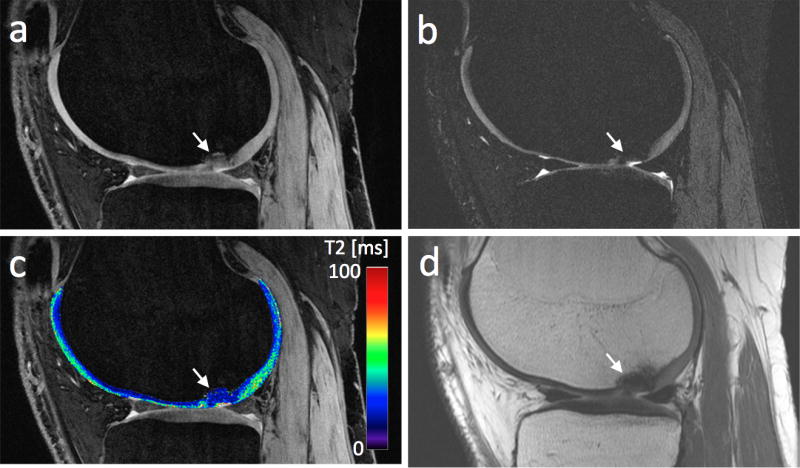
Methods: Extended Phase Graph (EPG) modeling was used to develop a straightforward linear approximation of the relationship between the two DESS signals, enabling accurate T2 estimation from one DESS scan. Simulations were performed to demonstrate cancellation of different echo pathways to validate this simple model. The resulting analytic formula was compared to previous methods for T2 estimation using DESS and fast spin-echo scans in agar phantoms and knee cartilage in three volunteers and three patients. The DESS approach allows 3D (256×256×44) T2-mapping with fat suppression in scan times of 3-4min.

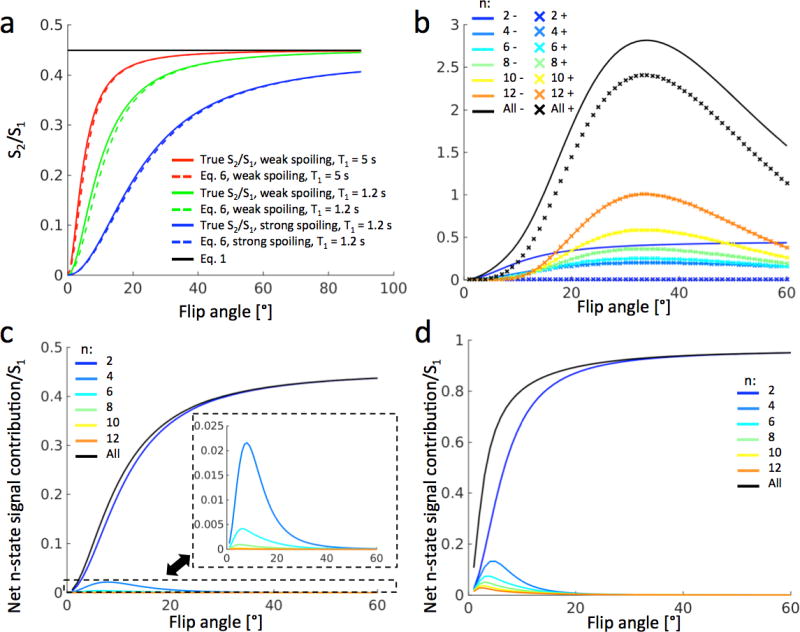
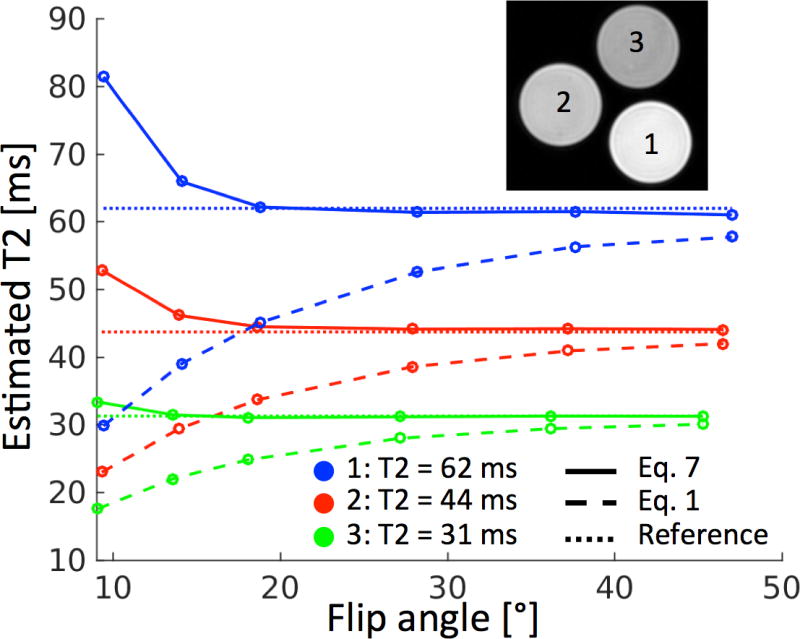
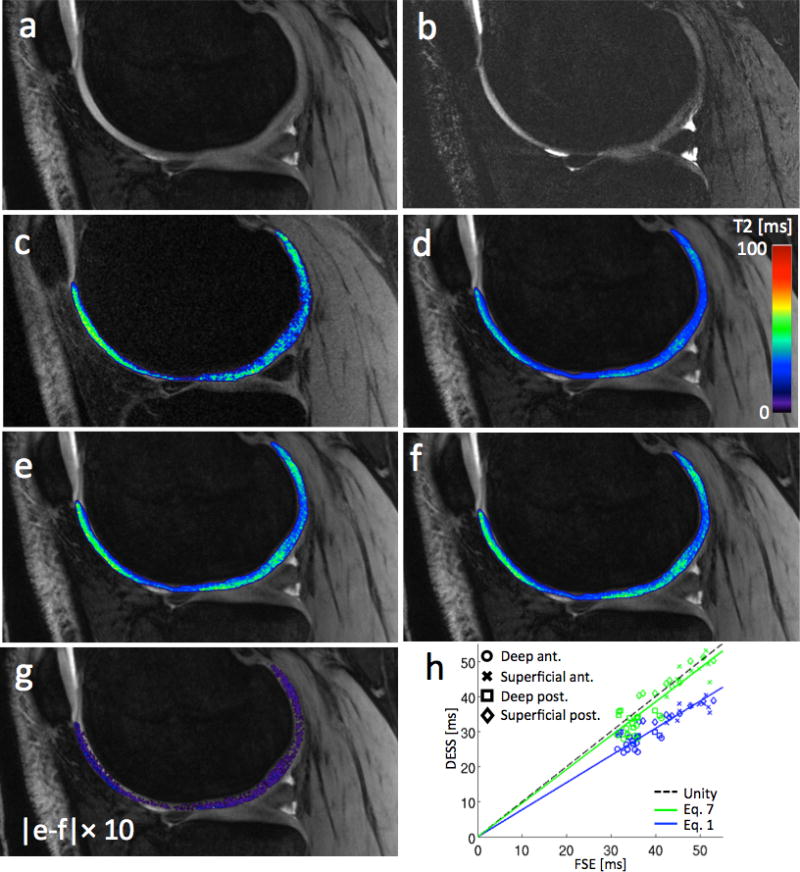
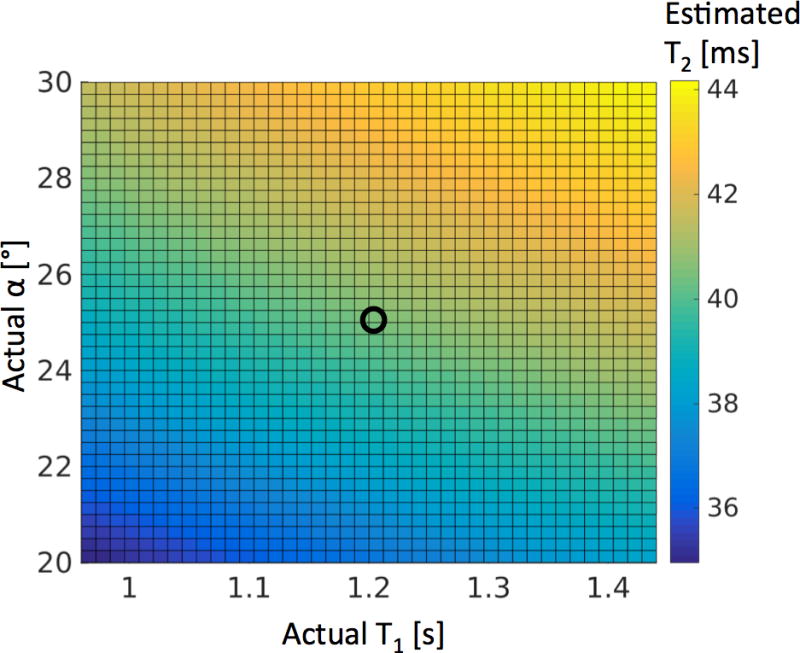
Results: The simulations demonstrated that the model approximates the true signal very well. If the T1 is within 20% of the assumed T1, the T2 estimation error was shown to be less than 5% for typical scans. The inherent residual error in the model was demonstrated to be small both due to signal decay and opposing signal contributions. The estimated T2 from the linear relationship agrees well with reference scans, both for the phantoms and in vivo. The method resulted in less underestimation of T2 than previous single-scan approaches, with processing times 60 times faster than using a numerical fit.

Conclusion: A simplified relationship between the two DESS signals allows for rapid 3D T2 quantification with DESS that is accurate, yet also simple. The simplicity of the method allows for immediate T2 estimation in cartilage during the MRI examination.

Keywords: Cartilage; DESS; Osteoarthritis; T(2).


Figures

Figure 1
Figure 1
Diagrams showing dephasing across a voxel as a function of time using graphics similar to ref. [18]. In each panel, we consider the magnetization at the time of the right blue dot and examine the components from the time of the left blue dot that contributed to it. Graphical representations are shown of transverse and longitudinal states (above and below the dotted line, respectively). The accrued phase of the transverse magnetization is represented by the distance of the black line from the time axis. (a) The state that contributes to the measurable signal (S2) before the RF pulse is the “negatively dephased” signal following the previous RF pulse. (b) Two relevant paths before the RF pulse contribute to the state in panel a [21], shown with black arrows. These are transverse and longitudinal states that have a net dephasing from one gradient. They also contribute to the longitudinal state following the RF pulse (gray arrows). (c) The measurable signal following the previous RF pulse (S1), before dephasing by the gradient, contributes to the “positively dephased” transverse pathway from panel b. This is the desired endpoint so the pathway is not retraced further backward. The longitudinal pathway is not dephased by the gradient. The contribution of a third transverse pathway has been ignored since it comes from a doubly dephased signal, which can be neglected (shown with red x’s). This gives a recursive relationship between S1 and S2 that can be easily solved, resulting in Eq. (6).
Figure 2
Figure 2
(a) Comparison of proposed model of Eq. (6) (dashed) with complete simulations (colored solids) and with the simple exponential model of Eq. (1) (black solid) in a tissue with T2 = 40 ms. The blue (bottom) curves correspond to strong spoiling (gradient moment 156.6 mT/m•ms) and the green (middle) curves to weak spoiling (gradient moment 0.001 mT/m•ms), both with T1 = 1.2 s. The red (top) curves correspond to weak spoiling and T1 = 5 s. The green curves represent DESS scans that can be used for T2 estimation in cartilage. (b) Positive (dashed) and negative (solid) contributions to S2/S1 from pathways spending 2–12 TRs in the transverse plane. The black curves represent the sum of the different pathways. For pathways of order 6 and above, the positive (×) curves overlap with the negative (solid) curves. (c) Net contributions from the pathways in panel b shows that pathways with more than 2 TRs in the transverse plane contribute minimally. (d) The same simulations as in panel c, performed for synovial fluid at 3T (T1 = 3.6 s, T2 = 0.77 s), showing that the proposed model (blue signal) approximates the true signal (black curve) well for flip angles above 20°, even for long T1 and T2.
Figure 3
Figure 3
Results from estimating T2 from DESS using Eq. (1) (dashed) and Eq. (7) (solid) as well as from reference FSE scans (dotted). For all phantoms, Eq. (7) clearly agrees better with the reference value than Eq. (1), and for flip angles of 20° or higher, Eq. (7) agrees very well with the reference scans.
Figure 4
Figure 4
(a) The first echo (S1) from a sample sagittal DESS scan. (b) The second echo (S2) from the same DESS scan. The windowing level is not the same as in panel a, in order to show the cartilage. (c) A sample T2 map from FSE scans of the subject in panels a–b. (d) T2 map of articular cartilage from a the DESS scan in panels a–b using Eq. (1). (e) T2 map using Eq. (7). (f) T2 map using a full numerical fit. The map looks very similar to the one in panel e, but took about 60× longer to produce. (g) A map showing the absolute difference between the maps in panels e and f, multiplied by 10. The difference in the cartilage is small, mostly 1 ms or less. Zero difference appears as transparent. (h) The T2 estimates from 4 regions of femoral cartilage in a total of 10 slices from 3 subjects. The trend line for Eq. (7) (green) better agrees with the FSE scans.
Figure 5
Figure 5
(a) The first echo of a DESS scan of a patient with a chondral lesion (white arrow). (b) The second echo of the DESS scan. Panels a and b both show cartilage signal heterogeneity in the central femoral condyle (note the different windowing settings). (c) The T2 maps resulting from applying Eq. (7) to the data in panels a–b. (d) A PD weighted scan, acquired for reference, shows low signal in the lesion.
Figure 6
Figure 6
The sensitivity of the T2 estimation method in Eq. (7) to errors in the assumption of T1 and B1. The true T2 is 40 ms. The flip angle α and T1 are assumed to be 25° and 1.2 s, but actually vary from these values by +/− 20%. Other scan parameters were the same as in Fig. 2a. The black circle shows the point where the assumptions of α and T1 are correct.

Similar articles

Cited by

References

    1. Bruder H, Fischer H, Graumann R, Deimling M. A New Steady-State Imaging Sequence for Simultaneous Acquisition of Two MR Images with Clearly Different Contrasts. Magnetic Resonance in Medicine. 1988;7:35–42. - PubMed
    1. Redpath TW, Jones RA. FADE - A New Fast Imaging Sequence. Magnetic Resonance in Medicine. 1988;6:224–234. - PubMed
    1. Lee SY, Cho ZH. Fast SSFP Gradient Echo Sequence for Simultaneous Acquisitions of FID and Echo Signals. Magnetic Resonance in Medicine. 1988;8:142–150. - PubMed
    1. Moran CJ, Saranathan M, Nnewihe AN, Granlund KL, Alley MT, Daniel BL, Hargreaves BA. High resolution images of the breast. European Journal of Radiology. 2012;81S1:S101–S103. - PubMed
    1. Granlund KL, Staroswiecki E, Alley MT, Daniel BL, Hargreaves BA. High-resolution, three-dimensional diffusion-weighted breast imaging using DESS. Magnetic Resonance Imaging. 2014;32:330–341. - PMC - PubMed

Publication types