. 2017 Mar;1862(3):358-368.
doi: 10.1016/j.bbalip.2016.12.009. Epub 2016 Dec 23.

Critical role of the peroxisomal protein PEX16 in white adipocyte development and lipid homeostasis

Affiliations

Critical role of the peroxisomal protein PEX16 in white adipocyte development and lipid homeostasis

Dina C Hofer et al. Biochim Biophys Acta Mol Cell Biol Lipids. 2017 Mar.

Abstract

The importance of peroxisomes for adipocyte function is poorly understood. Herein, we provide insights into the critical role of peroxin 16 (PEX16)-mediated peroxisome biogenesis in adipocyte development and lipid metabolism. Pex16 is highly expressed in adipose tissues and upregulated during adipogenesis of murine and human cells. We demonstrate that Pex16 is a target gene of the adipogenesis "master-regulator" PPARγ. Stable silencing of Pex16 in 3T3-L1 cells strongly reduced the number of peroxisomes while mitochondrial number was unaffected. Concomitantly, peroxisomal fatty acid (FA) oxidation was reduced, thereby causing accumulation of long- and very long-chain (polyunsaturated) FAs and reduction of odd-chain FAs. Further, Pex16-silencing decreased cellular oxygen consumption and increased FA release. Additionally, silencing of Pex16 impaired adipocyte differentiation, lipogenic and adipogenic marker gene expression, and cellular triglyceride stores. Addition of PPARγ agonist rosiglitazone and peroxisome-related lipid species to Pex16-silenced 3T3-L1 cells rescued adipogenesis. These data provide evidence that PEX16 is required for peroxisome biogenesis and highlights the relevance of peroxisomes for adipogenesis and adipocyte lipid metabolism.

Keywords: Adipogenesis; Lipid homeostasis; PEX16; PPARγ; Peroxisome.


Conflict of interest statement

Conflict of interest

The authors declare no potential conflict of interest.

Figures
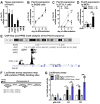
Fig. 1
Fig. 1
Pex16 is a functional target gene of the adipogenesis “master-regulator” PPARγ (A) Pex16 tissue mRNA expression in 8-10-week old male, ad libitum-fed C57BL/6 mice (n = 5). (B) Pex16 mRNA expression inhuman cells (Simpson-Golabi-Behmel syndrome) during adipogenic differentiation (n = 3). (C) Pex16 mRNA expression in3T3-L1 cells during adipogenic differentiation with or without addition of 1 μM PPARγ-agonist rosiglitazone to the culture medium. Student’s t-test (n = 3): *pb 0.05; ***pb 0.001 versus basal. (D) Pex16 mRNA expression in PPARγ−/− and PPARγ+/−- murine embryonic fibroblasts (MEFs) on day 8 of differentiation with or without addition of 1 μM rosiglitazone to the culture medium. (E) Genome organization of Pex16 showing two putative PPARγ binding sites, named R1 and R2, obtained from [39,40], adapted from UCSC genome browser (http://genome.uscs.edu). (F) Map of putative PPARγ binding sites R1 and R2 in the Pex16 sequence depicted in Fig. E, used for the luciferase assay. (G) Putative PPARγ/RXRα binding sites in the Pex16 sequence (R1, R2) were cloned into pGL4.26 luc-2-luciferase reporter vector. Cos7 cells were co-transfected with plasmids encoding luc-2 luciferase, renilla luciferase, and either empty pCMX vector or PPARγ/RXRα expressing vectors. Cells were treated with 1 μM rosiglitazone or DMSO 24 h prior to measurements. Luc2-luciferase activity was measured 48 h after transfection and normalized to renilla luciferase activity. (A)-(D),(G) Data are presented as mean ± SD. (D), (G) Statistical significance was calculated using one-way or two-way ANOVA and subsequent Tukey’s multiple comparisons test (n = 3). *p < 0.05, ** p < 0.01, ***p < 0.001 versus control. Main effects for the different constructs (R1, R2) versus pGL4.26 are denoted as § and for rosiglitazone treatment are denoted as #.
Fig. 2
Fig. 2
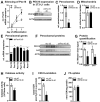
Silencing of Pex16 in 3T3-L1 fibroblasts impairs peroxisome formation and function (A)–(J) Stable silencing of Pex16 in 3T3-L1 fibroblasts. Undifferentiated 3T3-L1 cells were incubated with shRNA-containing lentiviral particles for Pex16 (shPex16) or non-targeting control virus (ntc) followed by antibiotic selection. (B)–(I) Data were collected from confluent fibroblasts on day 0. (A) Pex16 mRNA expression in 3T3-L1 cells during differentiation (n = 3). (B) PEX16 protein expression; one representative replicate is shown. Relative number of (C) peroxisomes and (D) mitochondria counted from ELMI pictures (n = 3). (E) RT-PCR analysis of genes involved in peroxisome assembly (Pex14, Pex11a, Pex11b) and peroxisomal lipid metabolism (Abcd2, Acox1) (n = 3). (F) Expression and (G) densitometric analysis of peroxisomal proteins PEX14 and catalase (CAT) (n = 3). (H) Catalase activity (n = 3). (I) Basal respiration in the presence of 10 μM hexacosanoic acid (C26:0). Cells were incubated with assay medium containing 10 μM C26:0 45 min prior to and during the measurement with Seahorse XF96 extracellular flux analyzer (n = 6). (J) 14C–oleic acid (OA) uptake determined after 30 min incubation on d2 of differentiation (n = 4). (A), (C)–(E), (G), (H), (J) Data are presented as mean ± SD (n ≥ 3). (I) Data are presented as mean ± SEM (n = 4). Statistical significance was calculated using Student’s t-test. *p < 0.05; **p < 0.01; ***p < 0.001 versus ntc.
Fig. 3
Fig. 3
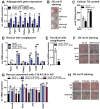
PEX16 is required for adipogenesis in 3T3-L1 cells (A)–(H) Data were collected from 3T3-L1 adipocytes atday 7. (A) RT-PCR analysis of adipogenesis marker and PPARγ target genes in ntc and shPex16 3T3-L1 cells on day 7 of differentiation treated with control retrovirus (pMSCV-puro) or Pex16-overexpressing (O/E) retrovirus (pMSCV-Pex16) for 48 h each on day −2, 0 and 3 of differentiation (n = 3). (B) Representative ORO staining of cells described in (A). (C) Cellular triglyceride (TG) content of day 7 ntc and shPex16 3T3-L1 cells, differentiated with or without 1 μM rosiglitazone (n = 3). (D) RT-PCR analysis of adipogenesis marker and PPARγ target genes in ntc and shPex16 3T3-L1 cells differentiated with or without 1 μM rosiglitazone (n = 3). (E) Pex16 mRNA expression in day 7 ntc and shPex16 cells treated with 1 μM rosiglitazone during adipogenesis (n = 3). (F) Representative ORO staining of cells described in (D). (G),(H) Rescue of adipogenesis in shPex16 3T3-L1 cells with ether lipids. (G) RT-PCR analysis of various genes in ntc and shPex16 3T3-L1 cells on day 7 differentiated with or without addition of 10 μM 1-O-hexadecyl-rac-glycerol (C16:0-AG) or 10 μM 1-O-octadecyl-rac-glycerol (C18:0-AG) (n = 3). (H) Representative ORO staining of day 7 ntc and shPex16 3T3-L1 cells from (G). (A), (C), (D), (E), (G) Data are presented as mean ± SD (n ≥ 3). Statistical significance was calculated using Student’s t-test, one-way or two-way ANOVA and subsequent Tukey’s multiple comparisons test (n = 3). *p < 0.05, ** p < 0.01, ***p < 0.001 versus ntc. Main effects of the different treatments versus according untreated samples are denoted as #.
Fig. 4
Fig. 4
Lipid homeostasis is altered in Pex16-silenced 3T3-L1 adipocytes (A)-(D) Total lipids were extracted from ntc and shPex16 3T3-L1 cells on day 7 of differentiation and analyzed by UPLC-qTOF-MS.(A) Mean area of total intracellular saturated (SFA), monounsaturated (MUFA), polyunsaturated (PUFA), and odd-chain FAs (n = 3). (B) Profile of unsaturated long-chain (LC) and very long-chain (VLC) FAs (n = 3). (C) Area ratio of phosphatidylcholine (PC) and phosphatidylethanolamine (PE) (n = 3). (D) Ratio of C16:1 to C16:0 FAs (n = 3). (E) RT-PCR analysis of genes (for abbreviations see Table S2) involved inFA transport, lipogenesis and lipolysis inntc and shPex16 3T3-L1 cells on day 7 of differentiation (n = 3). (F) Expression of FA synthesis proteins acetyl-CoA carboxylase (ACC1) and fatty acid synthase (FAS) in ntc and shPex16 3T3-L1 cells on day 7 of differentiation. (G) Glycerol content (n = 3) and (H) free fatty acid (FFA) content (n = 6) in the supernatant of day 7 ntc and shPex16 3T3-L1 cells after 4 h serum-starvation with or without isoproterenol treatment (10 μM). (I) 14C–oleic acid (OA) uptake into ntc and shPex16 3T3-L1 cellson day 6 of differentiation after 30 min incubation. (J) Luciferase assay to assess PPARγ activation in ntc and shPex16 3T3-L1 cells. Preconfluent ntc and shPex16 3T3-L1 cells were co-electroporated with firefly luciferase reporter vector and empty pCMX or PPARγ/RXRα-expressing vectors. Co-electroporation of renilla luciferase encoding vector served as control for varying electroporation efficiencies. After 24 h, medium was changed to CM from day 7 ntc or shPex16 3T3-L1 cells. Firefly luciferase activity was measured 48 h after electroporation and normalized to renilla luciferase activity, (n = 3). (A)–(E), (G)–(J) Data are presented as mean ± SD (n ≥ 3). Statistical significance was calculated using Student’s t-test, one-way or two-way ANOVA and subsequent Tukey’s multiple comparisons test (n = 3). *p < 0.05, ** p < 0.01, ***p < 0.001 versus control. Main effects of the different constructs (pCMX, Pparγ/RxRα) are denoted as § and different treatments are denoted as #.
Fig. 5
Fig. 5
Transient silencing of Pex16 in mature 3T3-L1 adipocytes (A)–(H) Transient silencing of Pex16 in mature 3T3-L1 adipocytes (day 5 of differentiation) by electroporation (EP) of 200 nM control siRNA (si-ctrl) or siRNA directed against Pex16 (si-Pex16). (A) RT-PCR analysis of Pex16 expression 48 h, 60 h and 72 h after EP of 3T3-L1 adipocytes with siRNA. (B)–(H) Data analyzed from si-ctrl and si-Pex16 3T3-L1 adipocytes at day 7 (=48 h after EP). (B) RT-PCR analysis of peroxisomal genes (Pex16, Pex11b, Pex14, Catalase, Gnpat), adipogenesis marker genes (Pparγ, aP2) and fatty acid metabolism genes (Cd36, Fas). (C) Protein expression and (D) densitometric analysis of PEX16, PEX14 and fatty acid synthase (FAS). (E) Relative number of peroxisomes counted from ELMI pictures. (F) Catalase activity. (G) 14C–oleic acid (OA) uptake into si-ctrl and si-Pex16 3T3-L1 cells after 30 min incubation. (H) Oxygen consumption rate in the presence of 10 μM hexacosanoic acid (C26:0). Cells were incubated with assay medium containing 10 μM C26:0 45 min prior to and during the measurement with Seahorse XF96 extracellular flux analyzer (n = 4). (A),(B),(D)–(G) Data are presented as mean ± SD (n = 3). (H) Data are presented as mean ± SEM. Statistical significance was calculated using Student’s t-test. *p < 0.05, ** p < 0.01, ***p < 0.001 versus control.

Similar articles

Cited by

References

    1. Prokesch A, Hackl H, Hakim-Weber R, Bornstein SR, Trajanoski Z. Novel insights into adipogenesis from omics data. Curr Med Chem. 2009;16(23):2952–2964. - PMC - PubMed
    1. Hakim-Weber R, Krogsdam A-M, Jørgensen C, Fischer M, Prokesch A, Bogner-Strauss JG, et al. Transcriptional regulatory program in wild-type and retinoblastoma gene-deficient mouse embryonic fibroblasts during adipocyte differentiation. BMC Res Notes. 2011;4(1):157. doi: 10.1186/1756-0500-4-157. - DOI - PMC - PubMed
    1. Prokesch A, Bogner-Strauss JG, Hackl H, Rieder D, Neuhold C, Walenta E, et al. Arxes: retrotransposed genes required for adipogenesis. Nucleic Acids Res. 2011;39(8):3224–3239. doi: 10.1093/nar/gkq1289. - DOI - PMC - PubMed
    1. Savage DB. PPAR[gamma] as a metabolic regulator: insights from genomics and pharmacology. Expert Rev Mol Med. 2005;7(01):1–16. doi: 10.1017/S1462399405008793. - DOI - PubMed
    1. Rosen ED, MacDougald OA. Adipocyte differentiation from the inside out. Nature Reviews, Mol Cell Biol. 2006;7(12):885–896. doi: 10.1038/nrm2066. - DOI - PubMed

Publication types

MeSH terms

LinkOut - more resources