. 2017 Apr:87:71-80.
doi: 10.1016/j.jpsychires.2016.12.011. Epub 2016 Dec 12.

Intrinsic inter-network brain dysfunction correlates with symptom dimensions in late-life depression

Affiliations

Intrinsic inter-network brain dysfunction correlates with symptom dimensions in late-life depression

Wenjun Li et al. J Psychiatr Res. 2017 Apr.

Abstract

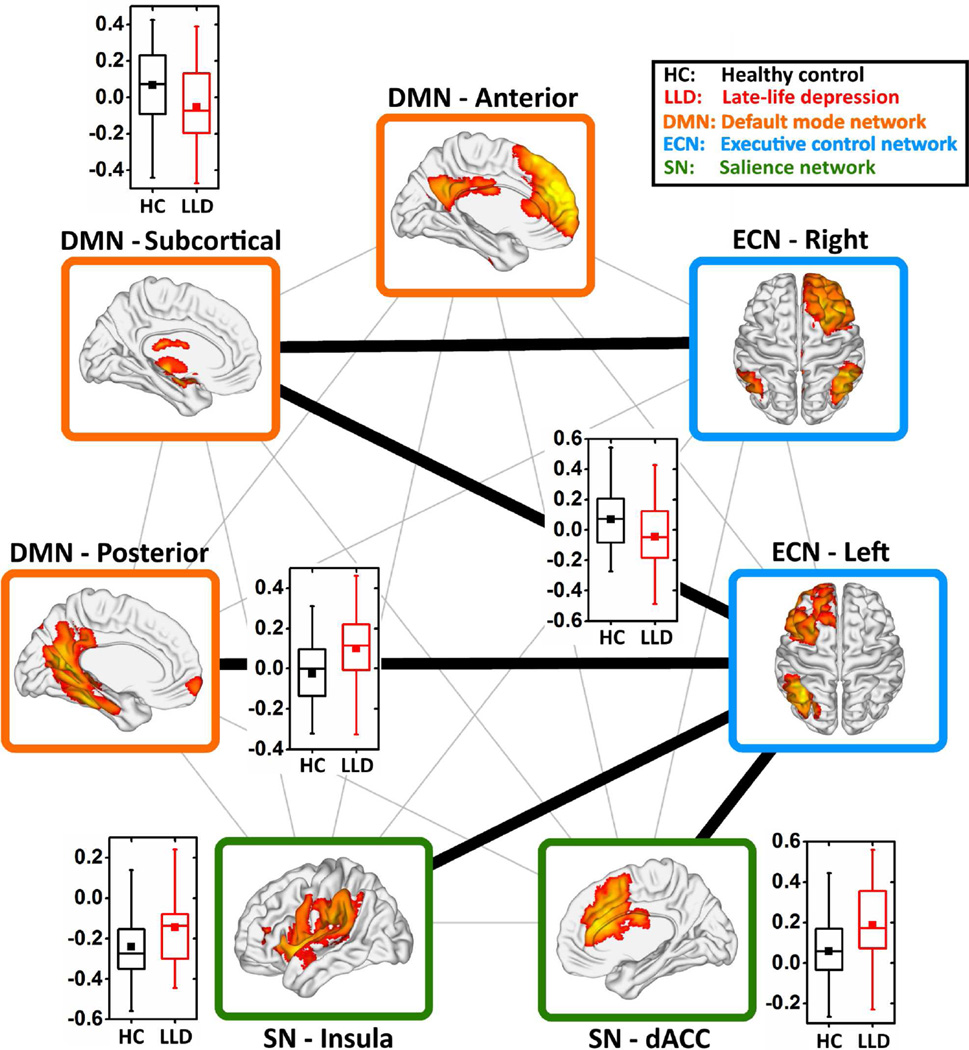
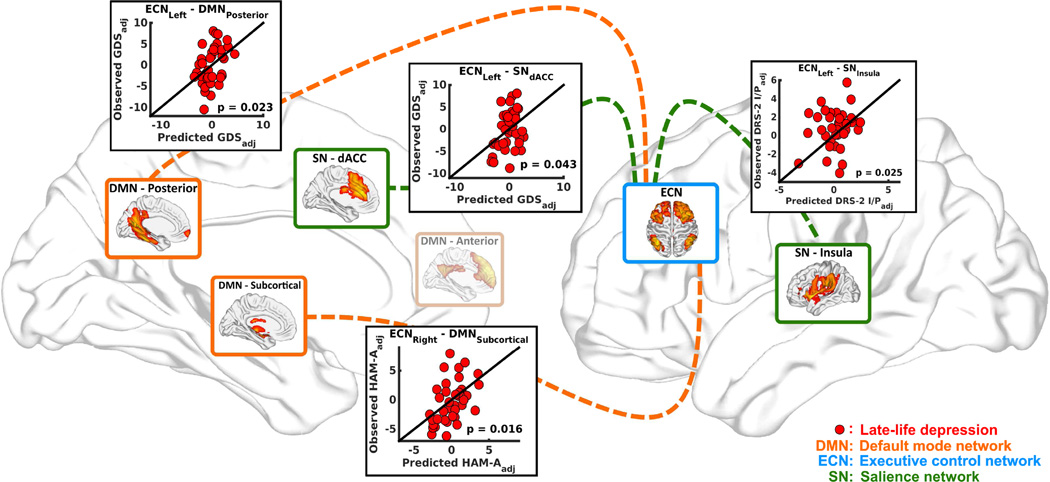
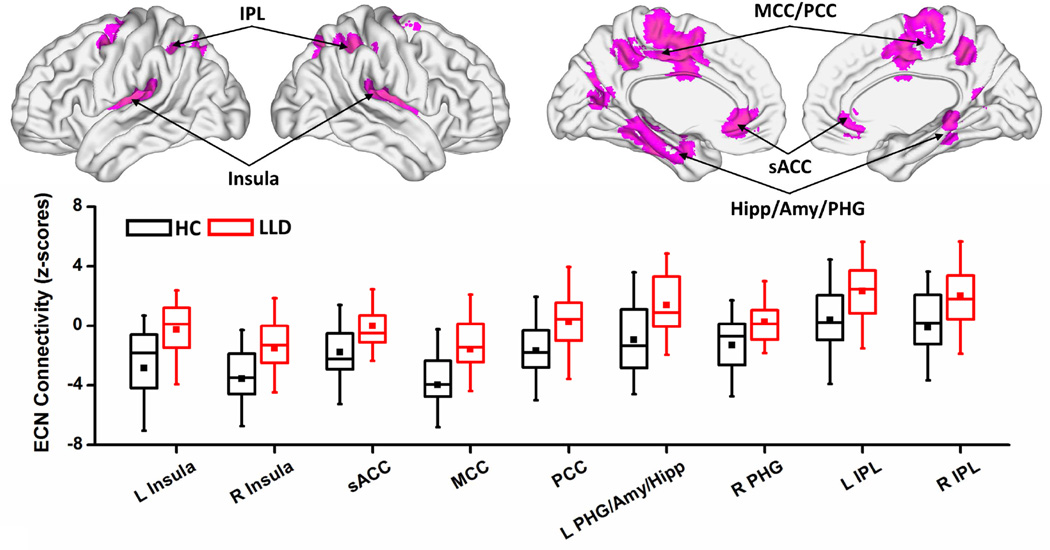
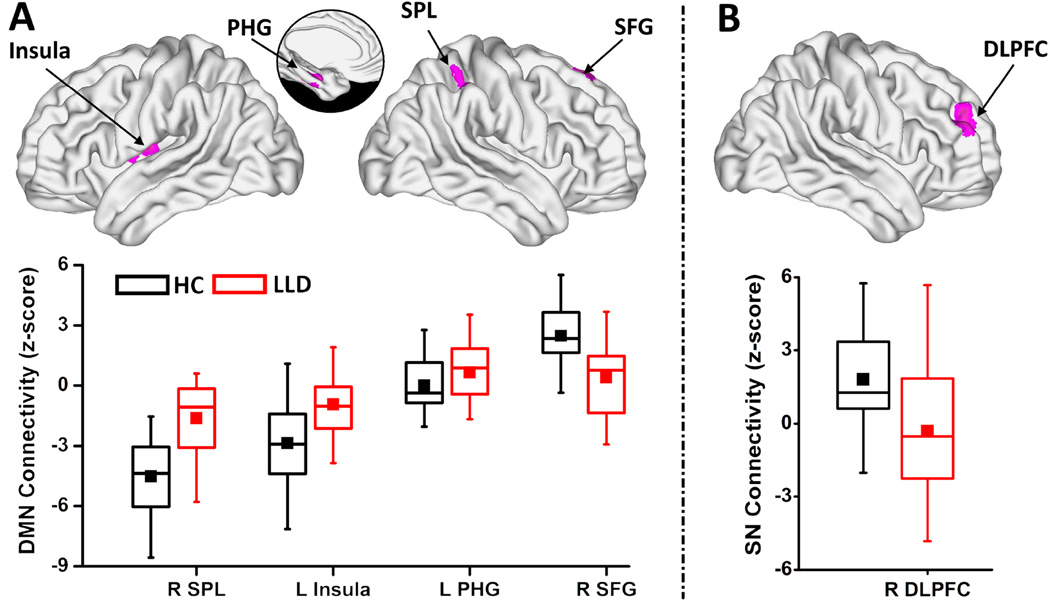
Prior studies have demonstrated dysfunctions within the core neurocognitive networks (the executive control [ECN], default mode [DMN] and salience [SN] networks) in late-life depression (LLD). Whether inter-network dysfunctional connectivity is present in LLD, and if such disruptions are associated with core symptom dimensions is unknown. A cross-sectional resting-state functional connectivity magnetic resonance imaging investigation was conducted of LLD (n = 39) and age- and gender-equated healthy comparison (HC) (n = 29) participants. Dual regression independent component analysis approach was used to identify components that represented the ECN, DMN and SN. The intrinsic inter-network connectivity was compared between LLD and HC participants and the relationship of inter-network connectivity abnormalities with dimensional measures was examined. Relative to HC participants, LLD subjects showed decreased inter-network connectivity between the bilateral ECN and default mode subcortical (thalamus, basal ganglia and ventral striatum) networks, and the left ECN and SN insula component; and increased inter-network connections between the left ECN and posterior DMN and salience (dorsal anterior cingulate) network components. Distinct inter-network connectivity abnormalities correlated with depression and anxiety severity, and executive dysfunction in LLD participants. LLD subjects also showed pronounced intra-network connectivity differences within the ECN, whereas fewer but significant DMN and SN disruptions were also detected. Investigating the intrinsic inter-network functional connectivity could provide a mechanistic framework to better understand the neural basis that underlies core symptom dimensions in LLD. Inter-network connectivity measures have the potential to be neuroimaging biomarkers of symptom dimensions comprising LLD, and may assist in developing symptom-specific treatment algorithms.

Keywords: Brain networks; ICA; Inter-network; Late-life depression; Resting-state functional connectivity; Symptom dimensions.


Conflict of interest statement

FINANCIAL DISCLOSURES

Conflict of Interest Disclosures:

Drs. W. Li, Wang, and Mr. Ward report no biomedical financial interests or potential conflicts of interest. Within the past five years, Dr. Antuono has served on the speaker bureaus of Novartis and Pfizer. Dr. Antuono reports research support from Myriad, Glaxo Smith Kline, Pfizer, ICON, Premier Rach, Octa Pharma, Eisai, Bristol Myers Squibb, Janssen, Baxter and Elan; and Dr. Shi-Jiang Li reports research grant funding from the National Institute on Aging and Pfizer; in addition, he has served as a consultant for Bristol-Meyers Squibb and BrainSymphonics, LLC. Dr. Goveas reports grant support from the Alzheimer’s Association International grant program, Brain and Behavior Research Foundation (formerly NARSAD) Young Investigator program, Extendicare (now RECALL) Foundation, and Advancing Healthier Wisconsin Endowment for Research to MCW.

Figures

Figure 1
Figure 1. Disrupted inter-network intrinsic connectivity in late-life depression
The inter-network INC was calculated as the partial-correlation among the unique time courses of the seven independent components, which were selected to indicate the three intrinsic functional connectivity networks (i.e. ECN, blue color; DMN, orange color; and SN, green color). The thick black lines between each pair of components represent functional connectivity differences between the HC and LLD groups. The box plots show the details of the between-group comparisons (two-sample t-test, FDR-corrected q < 0.05). The vertical axes represent the functional connectivity. The black and red boxes represent the HC and LLD groups, respectively. Abbreviations: ECN, executive control network; DMN, default mode network; SN, salience network; FDR, false discovery rate; HC, healthy comparison; LLD, late-life depression.
Figure 2
Figure 2. Relationships between the multi-domain symptom measurements and abnormal INC
Distinct inter-network functional connectivity abnormalities in the LLD group predicted symptom dimension scores (i.e., GDS, HAM-A, LMII-DR, and MDRS-2 Init/Pers). The linear regression models were adjusted for age, gender, education, and whole-brain GMR. Each scatter plot shows predicted symptom dimension score based on internetwork functional connectivity value (x-axis) plotted against observed symptom dimension score (y-axis). Each red dot represents individual LLD participant. Abbreviations: INC, intrinsic network connectivity; LLD, late-life depression; GDS, geriatric depression scale; HAM-A, Hamilton anxiety scale; LMII-DR, education-adjusted Logical Memory II Delayed Paragraph Recall subscale from the Wechsler Memory Scale-Revised; MDRS-2 Init/Pers, Mattis Dementia Rating Scale – 2 Initiation/Perseveration subscale; dACC, dorsal anterior cingulate.
Figure 3
Figure 3. Voxelwise intra-network functional connectivity differences between HC and LLD groups in the ECN
Voxelwise two-sample t-test (top, magenta colored regions) shows the spatial extent of the intra-network abnormalities in the ECN (p < 0.0167 and 3dClustSim corrected cluster size > 664 mm3). The box plots (bottom) indicate the quantitative data distribution of the individual groups (HC: black color and LLD: red color). In the box plots, the bands, from the top, represent the 75%, median, and 25%, respectively. The square in each box indicates the mean and whiskers shows the first standard deviation of the data. Abbreviations: HC, healthy comparison; LLD, late-life depression; L/R, left/right; sACC, subgenual anterior cingulate cortex; MCC, middle cingulate cortex; PCC, posterior cingulate cortex; PHG, parahippocampal gyrus; Amy, amygdala; Hipp, hippocampus; IPL, inferior parietal lobe.
Figure 4
Figure 4. Voxelwise intra-network functional connectivity differences between HC and LLD groups in the DMN and SN
Voxelwise two-sample t-tests (top, magenta colored regions) show the spatial extent of the intra-network abnormalities in the (A) DMN and (B) SN (p < 0.0167 and 3dClustSim corrected cluster size > 664 mm3). The box plots (bottom) indicate the quantitative data distribution of the individual groups (HC: black color and LLD: red color). In the box plots, the bands, from the top, represent the 75%, median, and 25%, respectively. The square in each box indicates the mean and whiskers shows the first standard deviation of the data. Abbreviations: HC, healthy comparison; LLD, late-life depression; L/R, left/right; SPL, superior parietal lobe; PHG, parahippocampal gyrus; SFG, superior frontal gyrus; DLPFC, dorsolateral prefrontal cortex.

Similar articles

Cited by

References

    1. Abbott CC, Lemke NT, Gopal S, Thoma RJ, Bustillo J, Calhoun VD, Turner JA. Electroconvulsive therapy response in major depressive disorder: a pilot functional network connectivity resting state FMRI investigation. Frontiers in psychiatry. 2013;4:10. - PMC - PubMed
    1. Aizenstein HJ, Butters MA, Figurski JL, Stenger VA, Reynolds CF, 3rd, Carter CS. Prefrontal and striatal activation during sequence learning in geriatric depression. Biological psychiatry. 2005;58(4):290–296. - PubMed
    1. Aizenstein HJ, Butters MA, Wu M, Mazurkewicz LM, Stenger VA, Gianaros PJ, Becker JT, Reynolds CF, 3rd, Carter CS. Altered functioning of the executive control circuit in late-life depression: episodic and persistent phenomena. The American journal of geriatric psychiatry : official journal of the American Association for Geriatric Psychiatry. 2009;17(1):30–42. - PMC - PubMed
    1. Aizenstein HJ, Khalaf A, Walker SE, Andreescu C. Magnetic resonance imaging predictors of treatment response in late-life depression. J Geriatr Psychiatry Neurol. 2014;27(1):24–32. - PMC - PubMed
    1. Alexopoulos GS, Hoptman MJ, Kanellopoulos D, Murphy CF, Lim KO, Gunning FM. Functional connectivity in the cognitive control network and the default mode network in late-life depression. Journal of affective disorders. 2012;139(1):56–65. - PMC - PubMed

Publication types

MeSH terms