Review
. 2017 Jul 1:154:267-281.
doi: 10.1016/j.neuroimage.2016.12.019. Epub 2016 Dec 22.

Noise and non-neuronal contributions to the BOLD signal: applications to and insights from animal studies

Affiliations
Review

Noise and non-neuronal contributions to the BOLD signal: applications to and insights from animal studies

Shella D Keilholz et al. Neuroimage. .

Abstract

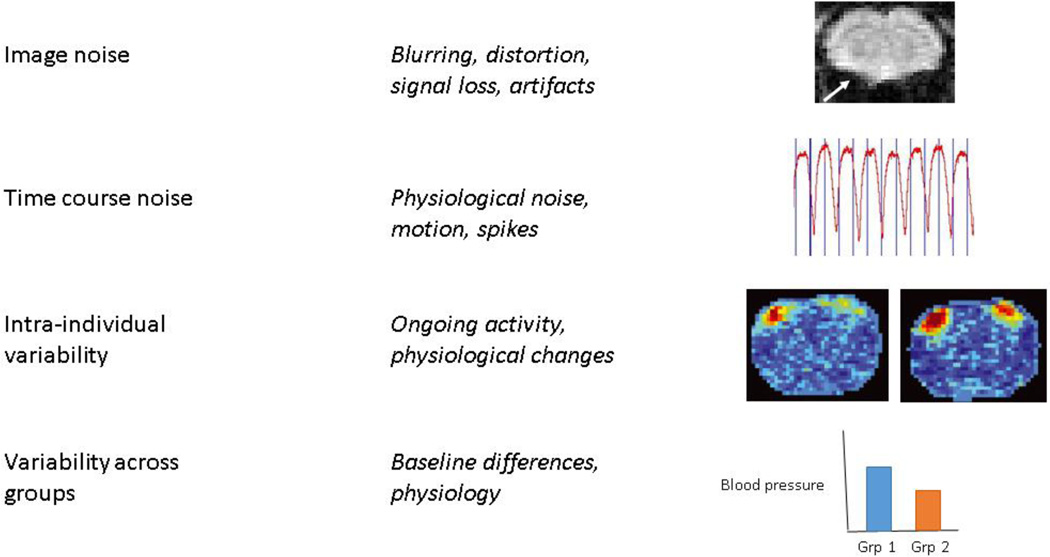
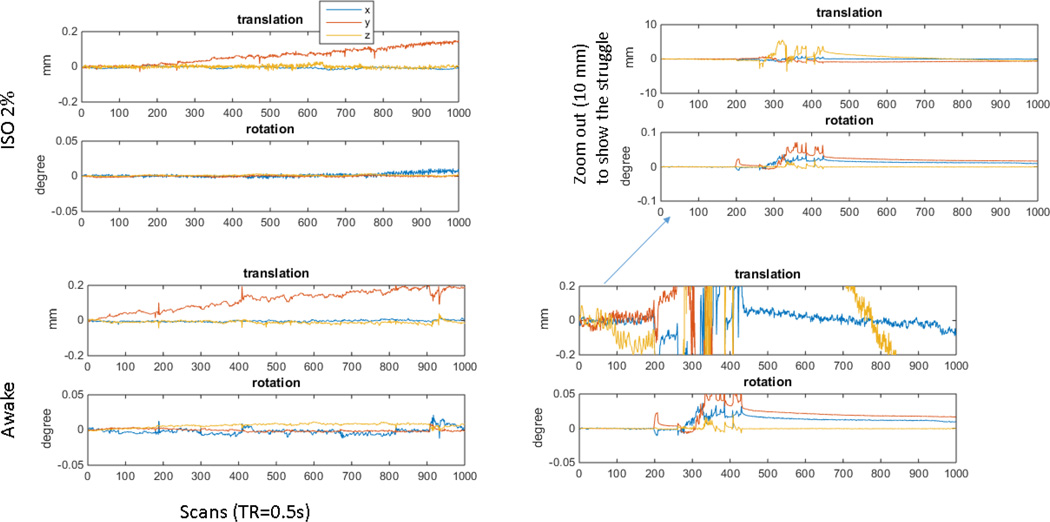
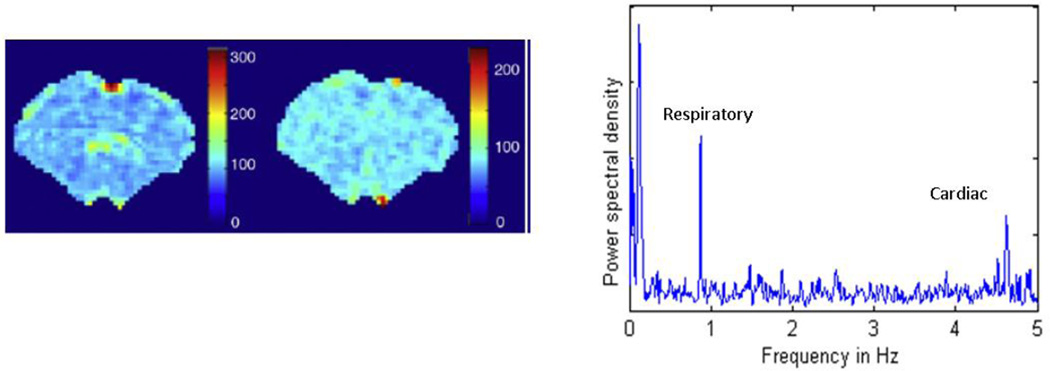
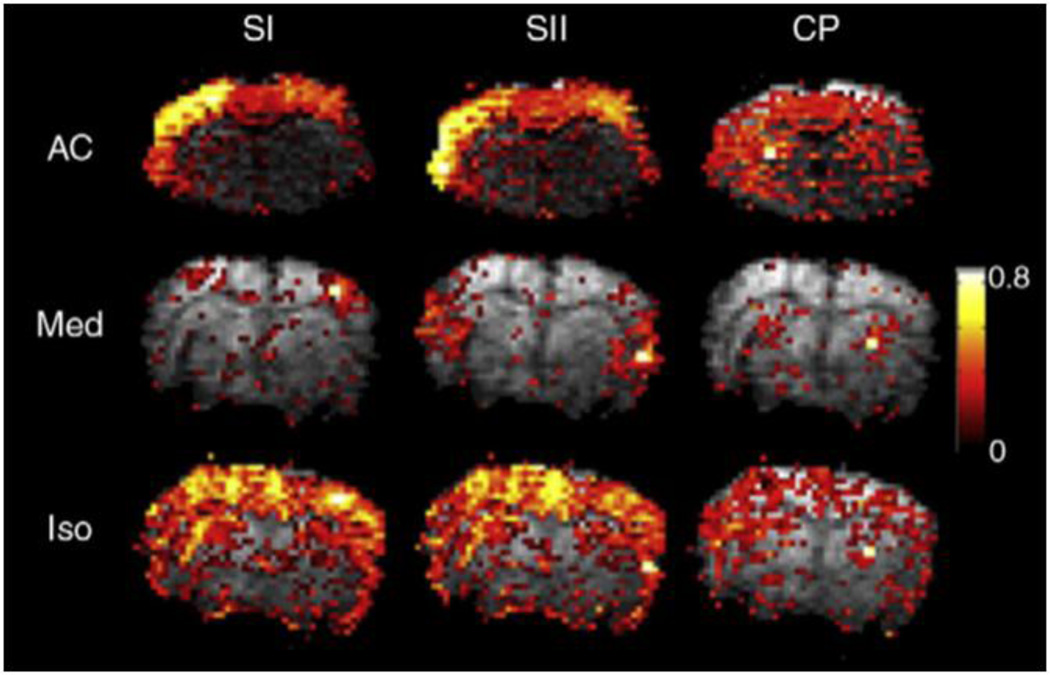
The BOLD signal reflects hemodynamic events within the brain, which in turn are driven by metabolic changes and neural activity. However, the link between BOLD changes and neural activity is indirect and can be influenced by a number of non-neuronal processes. Motion and physiological cycles have long been known to affect the BOLD signal and are present in both humans and animal models. Differences in physiological baseline can also contribute to intra- and inter-subject variability. The use of anesthesia, common in animal studies, alters neural activity, vascular tone, and neurovascular coupling. Most intriguing, perhaps, are the contributions from other processes that do not appear to be neural in origin but which may provide information about other aspects of neurophysiology. This review discusses different types of noise and non-neuronal contributors to the BOLD signal, sources of variability for animal studies, and insights to be gained from animal models.

Keywords: Animal studies; Functional MRI; Functional connectivity; Noise; Non-neuronal contributions; fMRI; rs-fMRI.


Figures

Figure 1
Figure 1. Types of noise
Image noise refers inaccuracies in the image due to acquisition strategies, including loss of contrast, distortion, and artifacts. The arrow in the image at top indicates distortion in a coronal gradient-echo EPI image of a rat brain acquired at 9.4 T due to the susceptibility mismatch at the air-tissue interface near the ear canals. Time course noise refers to noise that affects images differently at different time points, giving it a temporal structure. Common sources are respiration, cardiac pulsation, and motion. An example respiratory time course is shown. Intra-individual variability may result from changes in baseline physiology, ongoing activity in the brain, or other factors that can change the state of an individual over time. Two representative activation maps from a single rat acquired at different time points in one scanning session are shown at right (adapted from (Matthew Evan Magnuson et al., 2014)). Considerable variability can be seen in experimentally-identical acquisitions. Variability across groups is an important consideration for studies comparing functional neuroimaging data across groups of animals and can result from baseline differences, particularly in factors that affect vascular tone or the relative contribution of physiological noise. A hypothetical difference in baseline blood pressure across two groups is shown for illustration purposes.
Figure 2
Figure 2. Motion time course from an anesthetized rat
At top left are the translation and rotation time courses for a rs-fMRI scan (GE-EPI; TE 15 ms; TR 500 ms; 9.4 T) from a rat anesthetized with 1.2% isoflurane. Motion in x and y is well less than size of a voxel (0.4 mm). The linear drift in the y direction is likely due to a slow frequency drift that occurred as the temperature of the gradient rose, a problem that has been mitigated but not completely solved by the installation of a new gradient/shim insert (RRI, Billerica, MA) with better cooling and more stable temperature characteristics. The drift was corrected during postprocessing. For comparison, the time courses from a very successful study in an awake animal are shown at the bottom left. Motion is greater than in the anesthetized animal but remains below the size of a voxel throughout the scan. For contrast, a more typical scan from an awake rat is shown at the right. Sections of the scan have acceptable levels of motion, but a period of struggling beginning at ~ image 250 results in high amplitude motion that must be discarded prior to analysis.
Figure 3
Figure 3. Distribution of cardiac and respiratory noise in the anesthetized rat
(Left) The relative power for the respiration peak, plotted for each voxel in the brain. Most of the power is localized to medial surface areas near the sagittal sinus. (Center) The relative power for the cardiac peak, plotted for each voxel in the brain. Strong contributions are localized to a few spots near the surface and base of the brain. All data were obtained from a rs-fMRI scan in a rat anesthetized with alpha-chloralose and a TR of 100 ms (adapted from (Williams et al., 2010)). (Right) The power spectrum for one pixel demonstrating low frequency BOLD oscillations, respiration, and cardiac pulsation. Note that the animals in this study were anesthetized with alpha-chloralose and mechanically ventilated, which accounts for the sharpness of the respiratory peak.
Figure 4
Figure 4. Differences in functional connectivity under different anesthetics
Connectivity based on seed regions in primary somatosensory cortex, secondary somatosensory cortex, and the caudate putamen are shown for individual rats under three anesthetics (Williams et al., 2010). The strength of the correlation with the seed, the spatial extent, and the specificity vary by anesthetic and by network. Similar effects were observed during group analysis.
Figure 5
Figure 5. Functional connectivity and the effect of global signal regression in awake and anesthetized rats
Resting state MRI data was acquired from one rat that had been acclimated to the scanner. The rat was originally anesthetized with isoflurane, then allowed to wake up inside the MRI scanner as data was acquired. Correlation with a seed in somatosensory cortex is widespread and strong when the rat is anesthetized (left top) but localized to the somatomotor network when the rat is awake (left bottom). The awake rat also exhibits anticorrelation between cortical and subcortical regions. Interestingly, global signal regression increases the specificity of the connectivity map in the anesthetized rat and introduces anticorrelations similar to those observed in the awake animal. Global signal regression has little effect in the awake animal. The power spectra from the seed region in somatosensory cortex show a similar effect, with global signal regression reducing power in the data acquired under isoflurane (right top) but having relatively small effects on the data from the awake animal (right bottom).
Figure 6
Figure 6. BOLD power spectra from awake and anesthetized rats
Resting state MRI data (9.4T; TR 1s; TE 14ms; 20 slices; 0.5 × 0.5 × 1 mm voxels; 1000 repetitions) was acquired from two rats that had been acclimated to the scanner. Each was originally anesthetized with isoflurane, then allowed to wake up inside the MRI scanner as data was acquired. Power spectra were calculated for the whole brain BOLD signal by Welch's method with 8 segments and 50% overlap. In both animals, the power during the initial scan acquired under anesthesia is low but increases as the rat is allowed to wake up. Maximal power is observed in the second scan acquired with 0% isoflurane after the anesthetic has completely worn off. As the animals are re-anesthetized, the power decreases to approximately the original level.

References

    1. Abbas A, Majeed W, Thompson G, Keilholz SD. Phase of quasi-periodic patterns in the brain predicts performance on psychomotor vigilance task in humans. Proc Int Soc Magn Reson Med. 2016:1192.
    1. Adamczak JM, Farr TD, Seehafer JU, Kalthoff D, Hoehn M. High field BOLD response to forepaw stimulation in the mouse. Neuroimage. 2010;51:704–712. - PubMed
    1. Aksenov DP, Li L, Miller MJ, Iordanescu G, Wyrwicz AM. Effects of anesthesia on BOLD signal and neuronal activity in the somatosensory cortex. J. Cereb. Blood Flow Metab. 2015;35:1819–1826. - PMC - PubMed
    1. Azar T, Sharp J, Lawson D. Heart rates of male and female Sprague-Dawley and spontaneously hypertensive rats housed singly or in groups. J. Am. Assoc. Lab. Anim. Sci. 2011;50:175–184. - PMC - PubMed
    1. Bandettini PA, Wong EC, Hinks RS, Tikofsky RS, Hyde JS. Time course EPI of human brain function during task activation. Magn. Reson. Med. 1992;25:390–397. - PubMed

Publication types