Review
. 2016 Dec 15:10:101.
doi: 10.3389/fncir.2016.00101. eCollection 2016.

Local Field Potentials: Myths and Misunderstandings

Affiliations
Review

Local Field Potentials: Myths and Misunderstandings

Oscar Herreras. Front Neural Circuits. .

Abstract

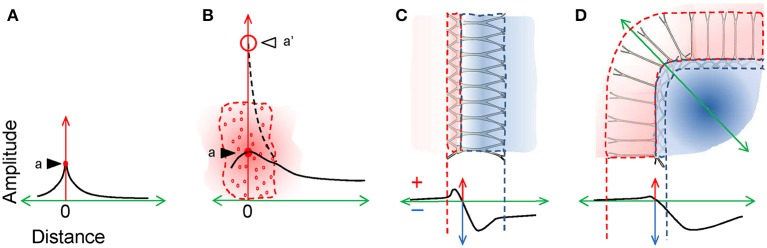
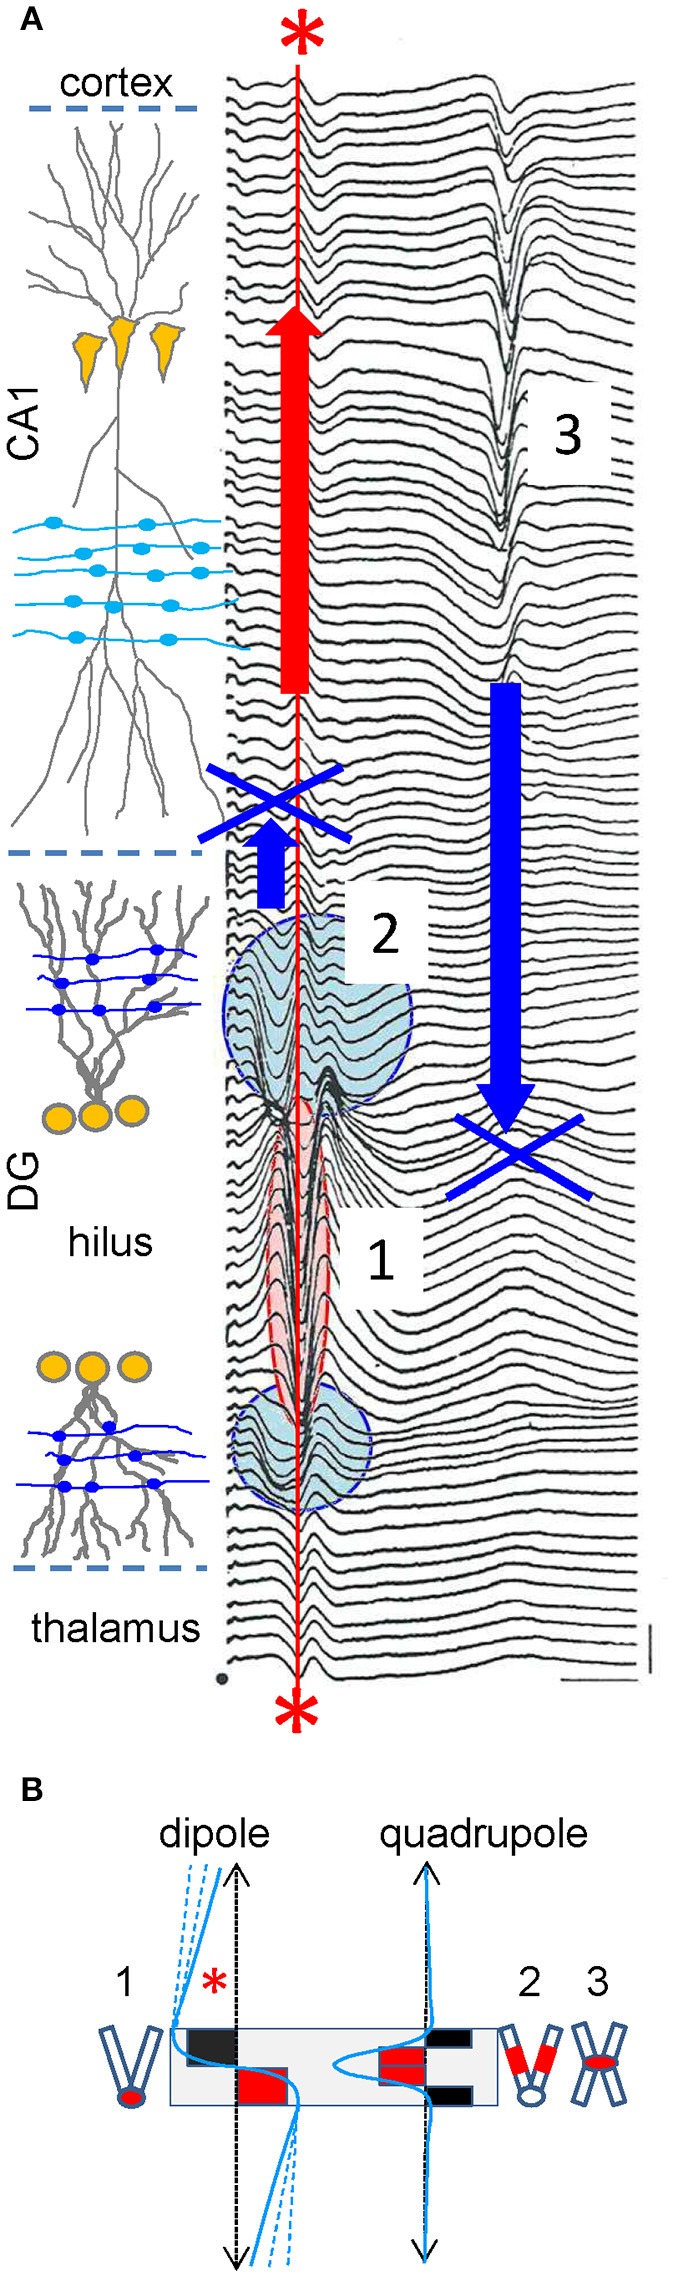
The intracerebral local field potential (LFP) is a measure of brain activity that reflects the highly dynamic flow of information across neural networks. This is a composite signal that receives contributions from multiple neural sources, yet interpreting its nature and significance may be hindered by several confounding factors and technical limitations. By and large, the main factor defining the amplitude of LFPs is the geometry of the current sources, over and above the degree of synchronization or the properties of the media. As such, similar levels of activity may result in potentials that differ in several orders of magnitude in different populations. The geometry of these sources has been experimentally inaccessible until intracerebral high density recordings enabled the co-activating sources to be revealed. Without this information, it has proven difficult to interpret a century's worth of recordings that used temporal cues alone, such as event or spike related potentials and frequency bands. Meanwhile, a collection of biophysically ill-founded concepts have been considered legitimate, which can now be corrected in the light of recent advances. The relationship of LFPs to their sources is often counterintuitive. For instance, most LFP activity is not local but remote, it may be larger further from rather than close to the source, the polarity does not define its excitatory or inhibitory nature, and the amplitude may increase when source's activity is reduced. As technological developments foster the use of LFPs, the time is now ripe to raise awareness of the need to take into account spatial aspects of these signals and of the errors derived from neglecting to do so.

Keywords: EEG; cell assembly; local field potentials; network oscillations; neuronal circuits; spatial discrimination; spontaneous activity; volume-conduction.


Figures

Figure 1
Figure 1
The same neurons produce countless different sources of current. (A) Spatiotemporal map of current sources and sinks obtained for a sample LFP epoch in the hippocampal CA1 region (the superimposed red trace is recorded in the st. radiatum). The large magnitude of the currents elicited by an input at distal dendrites (arrow) distorts the magnitude of currents produced by an adjacent oscillatory input at gamma frequency. Note the poor matching of the magnitude of currents and LFP gamma waves. Or, pyr, rad, l-m: strata oriens, pyramidale, radiatum, and lacunosum-moleculare. (B) The panels represent two-dimensional snapshots of computed field potentials generated in a volume by different combinations of synaptic inputs onto a realistic aggregate of hippocampal pyramidal cells, mimicking the spontaneous activity in the intact animal. The synaptic territories of afferent pathways are depicted by colored bars in the upper left panel (purple: distal excitation from entorhinal cortex; red: perisomatic basket cell inhibition; green: commissural excitatory input, blue: Schaffer excitatory input). Negative and positive potentials are coded in blue and yellow-red, respectively. Reproduced with permission from Martín-Vázquez et al. (2013) and Herreras et al. (2015). See animated reproduction in Video 1.
Figure 2
Figure 2
The scaling of dipolar currents to field potentials is distorted by AC coupling. Scheme representing how a train of spikes (multi-unit activity, MUA) afferent to a neuron population (left) produces a compound FP. Each spike produces an elementary synaptic current (small red and blue bumps) that sum in the extracellular space to others. The currents leave (red) or enter the cells (blue). For simplification, the FP (black line) is recreated only at two locations (FP1 and FP2) when recorded in DC-coupled mode, and only one is represented in AC-coupled mode (FP1). In the DC-mode, the FP1 and FP2 have mirror time courses and site-specific unique polarity. In the AC-coupled mode the slow (DC) components are removed and the FP is zeroed (the new baseline is artificial). The remaining fluctuations still preserve a similar time-course as the “skyline” of the native DC-potentials but suffer different and important distortions compared to the underlying currents: a and a′ denote epochs of similar flat FPs for large or null currents; b, b′, and b″ denote peaks in the FP of different polarity for similar levels of current (dashed line marked b-level); and c and c′ mark two FP waves with similar features that actually correspond to very different transients of the current. Also, net positive charge can be recorded as positive or negative FP values in different instants and sustained changes become reflected by short waves (d and c′).
Figure 3
Figure 3
The blending of multiple dipolar sources produces spatial indetermination of the contributions. Schematic representation of two different sources blending in a given space. For isolated sources, the positive and negative areas are well delimited by the structural factors and all values are proportional but for blended sources (as in the LFP), the quantitative contribution of the originals cannot be estimated: white areas may adopt any positive or negative value at different instants, and darkened red and blue areas adopt values in different sites that are not proportional between them.
Figure 4
Figure 4
Recording in AC- or DC-coupled mode produces entirely different spatiotemporal maps of LFPs. The figure illustrates the striking differences in the LFPs (A,C) and the corresponding currents (B,D) estimated from their voltage gradients when the presence of sustained components contributing to LFPs are considered (C,D). These are rejected by AC-coupled amplifiers and the resultant potentials become zeroed, creating spurious alternations of polarity (oscillations) from essentially sustained potentials. Reproduced with permission from Brankačk et al. (1993).
Figure 5
Figure 5
The configuration of the source at the origin determines the spatial reach. (A) A point source (dot labelled a) produces an electric field that decays exponentially with distance (the black trace represents the associated FP). (B) A complex source composed of many elementary point sources (small red circles) behaves differently in the region occupied by them and beyond. The local amplitude of the FP is defined by a site-specific volume average of the total charge density (represented as a single point source a in position zero), while the voltage adopts values according to the distribution of actual charges. However, the external portion (volume-conducted currents) behaves as if the charges had been unified in a single point (a' at position zero, and dashed line). Note that local-to-remote decay is far less pronounced than that for a point-source. (C) Dipolar currents of neurons produce intense cancellation within the sources and the spatial distribution of the FP is determined by the heterogeneous distribution of local charges. A laminated structure of parallel neurons behaves as a laminar dipole, with maximum positive and negative values typically within the source space (dashed lines in the plot). By contrast, the remote fields vary according to the subcellular location of the inputs and the cell geometry. (D) Curved structures produce differential clustering of currents outside the space of the source and the FP may then become larger than inside the area occupied by the source itself.
Figure 6
Figure 6
Experimental example of volume-conduction established by sources with a dipolar or quadrupolar charge distribution. (A) Spatial profile of evoked potentials recorded with a roving pipette through the hippocampal CA1 and DG regions in response to medial entorhinal cortex activation (step: 20 μM). The fEPSP (2) originated by granule cells is recorded at sites of synaptic contact only, while the monosynaptic population spike (1) is recorded locally and beyond the physical boundaries of the source cells in the hilus (between cell layers) and at distant sites in the CA1, cortex and thalamus (asterisks). By contrast, the trisynaptic pyramidal cell population spike in CA1 (3) is only recorded within the boundaries of the source cells. Modified with permission from Herreras (1986). (B) Dipole (left) and quadrupole (right) configurations of the charge distribution (red and black solid squares), and the associated FP profile at a distance (blue lines). The gray box marks the boundaries of the cell generators. The numbered cell dummies depict the cell morphology and zones activated by FPs in (A). Note the reach of dipolar sources (asterisk) compared to the quadrupolar self-contained profiles. The dashed blue lines indicate that FPs decay at lower rates away from the source as they extend further in a plane normal to the graph. In the quadrupolar configuration only the width of the profile is modified inside the source but it hardly changes at a distance from it.

Similar articles

Cited by

References

    1. Arieli A., Sterkin A., Grinvald A., Aertsen A. (1996). Dynamics of ongoing activity: explanation of the large variability in evoked cortical responses. Science 273, 1868–1871. 10.1126/science.273.5283.1868 - DOI - PubMed
    1. Bédard C., Kröger H., Destexhe A. (2004). Modeling extracellular field potentials and the frequency-filtering properties of extracellular space. Biophys. J. 86, 1829–1842. 10.1016/S0006-3495(04)74250-2 - DOI - PMC - PubMed
    1. Benito N., Fernández-Ruiz A., Makarov V. A., Makarova J., Korovaichuk A., Herreras O. (2014). Spatial modules of coherent activity in pathway-specific LFPs in the hippocampus reflect topology and different modes of presynaptic synchronization. Cereb. Cortex 24, 1738–1752. 10.1093/cercor/bht022 - DOI - PubMed
    1. Benito N., Martín-Vázquez G., Makarova J., Makarov V. A., Herreras O. (2016). The right hippocampus leads the bilateral integration of gamma-parsed lateralized information. eLife 5:e16658. 10.7554/eLife.16658 - DOI - PMC - PubMed
    1. Berens P., Keliris G. A., Ecker A. S., Logothetis N. K., Tolias A. S. (2008). Feature selectivity of the gamma-band of the local field potential in primate primary visual cortex. Front. Neurosci. 2, 199–207. 10.3389/neuro.01.037.2008 - DOI - PMC - PubMed

Publication types