Further Work on the Shaping of Cortical Development and Function by Synchrony and Metabolic Competition
- PMID: 28018202
- PMCID: PMC5145869
- DOI: 10.3389/fncom.2016.00127
Further Work on the Shaping of Cortical Development and Function by Synchrony and Metabolic Competition
Abstract
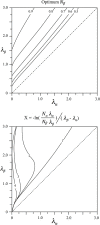
This paper furthers our attempts to resolve two major controversies-whether gamma synchrony plays a role in cognition, and whether cortical columns are functionally important. We have previously argued that the configuration of cortical cells that emerges in development is that which maximizes the magnitude of synchronous oscillation and minimizes metabolic cost. Here we analyze the separate effects in development of minimization of axonal lengths, and of early Hebbian learning and selective distribution of resources to growing synapses, by showing in simulations that these effects are partially antagonistic, but their interaction during development produces accurate anatomical and functional properties for both columnar and non-columnar cortex. The resulting embryonic anatomical order can provide a cortex-wide scaffold for postnatal learning that is dimensionally consistent with the representation of moving sensory objects, and, as learning progressively overwrites the embryonic order, further associations also occur in a dimensionally consistent framework. The role ascribed to cortical synchrony does not demand specific frequency, amplitude or phase variation of pulses to mediate "feature linking." Instead, the concerted interactions of pulse synchrony with short-term synaptic dynamics, and synaptic resource competition can further explain cortical information processing in analogy to Hopfield networks and quantum computation.
Keywords: cortical computation; cortical development; cortical information flow; synaptic development; synchronous oscillation.
Figures


Similar articles
-
The growth of cognition: Free energy minimization and the embryogenesis of cortical computation.Phys Life Rev. 2021 Mar;36:83-99. doi: 10.1016/j.plrev.2020.05.004. Epub 2020 Jun 1. Phys Life Rev. 2021. PMID: 32527680 Review.
-
On the dynamics of cortical development: synchrony and synaptic self-organization.Front Comput Neurosci. 2013 Feb 15;7:4. doi: 10.3389/fncom.2013.00004. eCollection 2013. Front Comput Neurosci. 2013. PMID: 23596410 Free PMC article.
-
Inhibition synchronizes sparsely connected cortical neurons within and between columns in realistic network models.J Comput Neurosci. 1996 Jun;3(2):91-110. doi: 10.1007/BF00160806. J Comput Neurosci. 1996. PMID: 8840227
-
Synaptic Mechanisms of Tight Spike Synchrony at Gamma Frequency in Cerebral Cortex.J Neurosci. 2015 Jul 15;35(28):10236-51. doi: 10.1523/JNEUROSCI.0828-15.2015. J Neurosci. 2015. PMID: 26180200 Free PMC article.
-
Topology and graph theory applied to cortical anatomy may help explain working memory capacity for three or four simultaneous items.Brain Res Bull. 2003 Apr 15;60(1-2):25-42. doi: 10.1016/s0361-9230(03)00030-3. Brain Res Bull. 2003. PMID: 12725890 Review.
Cited by
-
Unification of free energy minimization, spatiotemporal energy, and dimension reduction models of V1 organization: Postnatal learning on an antenatal scaffold.Front Comput Neurosci. 2022 Oct 14;16:869268. doi: 10.3389/fncom.2022.869268. eCollection 2022. Front Comput Neurosci. 2022. PMID: 36313813 Free PMC article.
-
The mesoanatomy of the cortex, minimization of free energy, and generative cognition.Front Comput Neurosci. 2023 May 12;17:1169772. doi: 10.3389/fncom.2023.1169772. eCollection 2023. Front Comput Neurosci. 2023. PMID: 37251599 Free PMC article.
-
Cortical development in the structural model and free energy minimization.Cereb Cortex. 2024 Oct 3;34(10):bhae416. doi: 10.1093/cercor/bhae416. Cereb Cortex. 2024. PMID: 39470397 Free PMC article.
-
Markov Blankets and Mirror Symmetries-Free Energy Minimization and Mesocortical Anatomy.Entropy (Basel). 2024 Mar 27;26(4):287. doi: 10.3390/e26040287. Entropy (Basel). 2024. PMID: 38667842 Free PMC article.
-
On the emergence of cognition: from catalytic closure to neuroglial closure.J Biol Phys. 2020 Mar;46(1):95-119. doi: 10.1007/s10867-020-09543-8. Epub 2020 Mar 4. J Biol Phys. 2020. PMID: 32130568 Free PMC article.
References
-
- Amit D. J. (1989). Modelling Brain Function. The World of Attractor Neural Networks. Cambridge: Cambridge University Press.
LinkOut - more resources
Full Text Sources
Other Literature Sources

