

Slowly Adapting Sensory Units Have More Receptors in Large Airways than in Small Airways in Rabbits
- PMID: 28018231
- PMCID: PMC5145901
- DOI: 10.3389/fphys.2016.00588
Slowly Adapting Sensory Units Have More Receptors in Large Airways than in Small Airways in Rabbits
Abstract
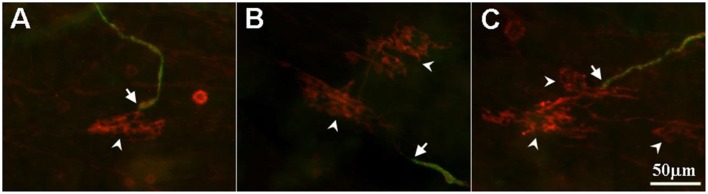
Sensory units of pulmonary slowly adapting receptors (SARs) are more active in large airways than in small airways. However, there is no explanation for this phenomenon. Although sensory structures in large airways resemble those in small airways, they are bigger and more complex. Possibly, a larger receptor provides greater surface area for depolarization, and thus has a lower activating threshold and/or a higher sensitivity to stretch, leading to more nerve electrical activities. Recently, a single sensory unit has been reported to contain multiple receptors. Therefore, sensory units in large airways may contain more SARs, which may contribute to high activities. To test this hypothesis, we used a double staining technique to identify sensory receptor sizes. We labeled the sensory structure with Na+/K+-ATPase antibodies and the myelin sheath with myelin basic protein (MBP) antibodies. A SAR can be defined as the end formation beyond MBP labeling. Thus, we are able to compare sizes of sensory structures and SARs in large (trachea and bronchi) vs. small (bronchioles <500 μm in diameter) airways in the rabbit. We found that even though the sensory structure was bigger in large airways than in small airways (3340 ± 223 vs. 1168 ± 103 μm2; P < 0.0001), there was no difference in receptor sizes (349 ± 14 vs. 326 ± 16 μm2; > 0.05). However, the sensory structure contains more SARs in large airways than in small airways (9.6 ± 0.6 vs. 3.6 ± 0.3; P < 0.0001). Thus, our data support the hypothesis that greater numbers of SARs in sensory units of large airways may contribute to higher activities.
Keywords: airway receptor; airway sensors; lung afferents; sensory receptor; sensory receptor cells; sensory unit; vagus nerve.
Figures


Similar articles
-
A comparative study of bronchopulmonary slowly adapting receptors between rabbits and rats.Physiol Rep. 2022 Mar;10(6):e15069. doi: 10.14814/phy2.15069. Physiol Rep. 2022. PMID: 35343655 Free PMC article.
-
Neuroepithelial bodies not connected to pulmonary slowly adapting stretch receptors.Respir Physiol Neurobiol. 2004 Nov 30;144(1):1-14. doi: 10.1016/j.resp.2004.07.022. Respir Physiol Neurobiol. 2004. PMID: 15522698
-
Structure of slowly adapting pulmonary stretch receptors in the lung periphery.J Appl Physiol (1985). 2003 Jul;95(1):385-93. doi: 10.1152/japplphysiol.00137.2003. Epub 2003 Mar 28. J Appl Physiol (1985). 2003. PMID: 12665534
-
Functional morphology and physiology of slowly adapting pulmonary stretch receptors.Anat Rec A Discov Mol Cell Evol Biol. 2003 Jan;270(1):11-6. doi: 10.1002/ar.a.10004. Anat Rec A Discov Mol Cell Evol Biol. 2003. PMID: 12494485 Review.
-
Deflation-activated receptors, not classical inflation-activated receptors, mediate the Hering-Breuer deflation reflex.J Appl Physiol (1985). 2016 Nov 1;121(5):1041-1046. doi: 10.1152/japplphysiol.00903.2015. Epub 2016 Sep 1. J Appl Physiol (1985). 2016. PMID: 27586839 Review.
Cited by
-
A single baroreceptor unit consists of multiple sensors.Sci Rep. 2021 Nov 30;11(1):23111. doi: 10.1038/s41598-021-02563-x. Sci Rep. 2021. PMID: 34848803 Free PMC article.
-
Paradoxical response of pulmonary slowly adapting units during constant pressure lung inflation.Am J Physiol Regul Integr Comp Physiol. 2021 Aug 1;321(2):R220-R227. doi: 10.1152/ajpregu.00116.2021. Epub 2021 Jun 30. Am J Physiol Regul Integr Comp Physiol. 2021. PMID: 34189947 Free PMC article.
-
Spectrum of myelinated pulmonary afferents (III) cracking intermediate adapting receptors.Am J Physiol Regul Integr Comp Physiol. 2020 Dec 1;319(6):R724-R732. doi: 10.1152/ajpregu.00136.2020. Epub 2020 Oct 21. Am J Physiol Regul Integr Comp Physiol. 2020. PMID: 33085910 Free PMC article.
-
A comparative study of bronchopulmonary slowly adapting receptors between rabbits and rats.Physiol Rep. 2022 Mar;10(6):e15069. doi: 10.14814/phy2.15069. Physiol Rep. 2022. PMID: 35343655 Free PMC article.
References
-
- Coleridge H. M., Coleridge J. C. G. (1986). Reflexes evoked from tracheobronchial tree and lungs, in Handbook of Physiology, eds Cherniack N. S., Widdicombe J. G. (Bethesda: American Physiological Society; ), 395–430.
-
- Farber J. P., Fisher J. T., Sant'Ambrogio G. (1983). Distribution and discharge properties of airway receptors in the opossum, Didelphis marsupialis. Am. J. Physiol. 245, R209–R214. - PubMed
Grants and funding
LinkOut - more resources
Full Text Sources
Other Literature Sources
Miscellaneous