

Network Analysis-Based Approach for Exploring the Potential Diagnostic Biomarkers of Acute Myocardial Infarction
- PMID: 28018242
- PMCID: PMC5145872
- DOI: 10.3389/fphys.2016.00615
Network Analysis-Based Approach for Exploring the Potential Diagnostic Biomarkers of Acute Myocardial Infarction
Abstract
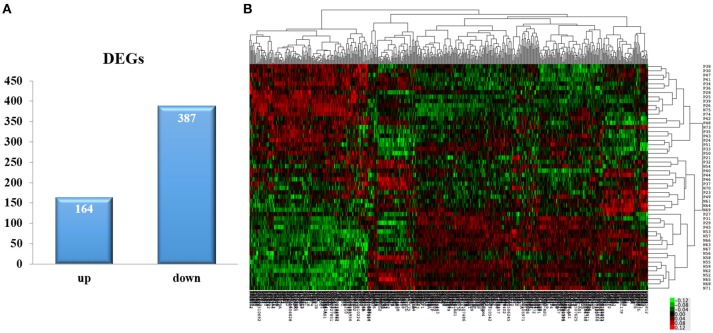
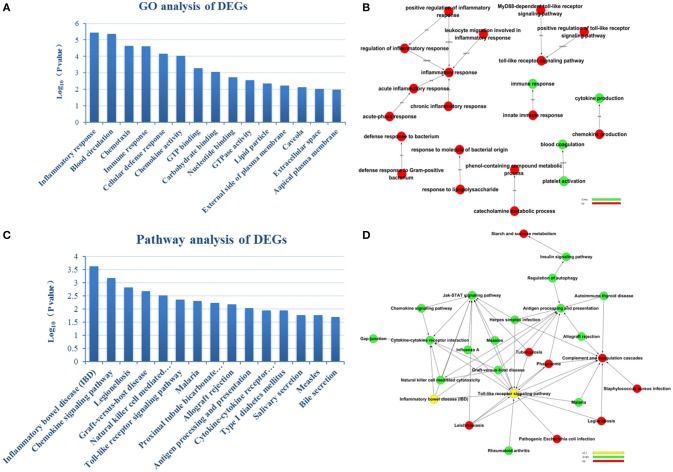
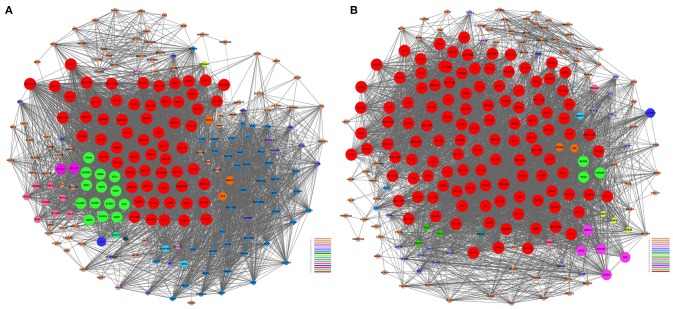
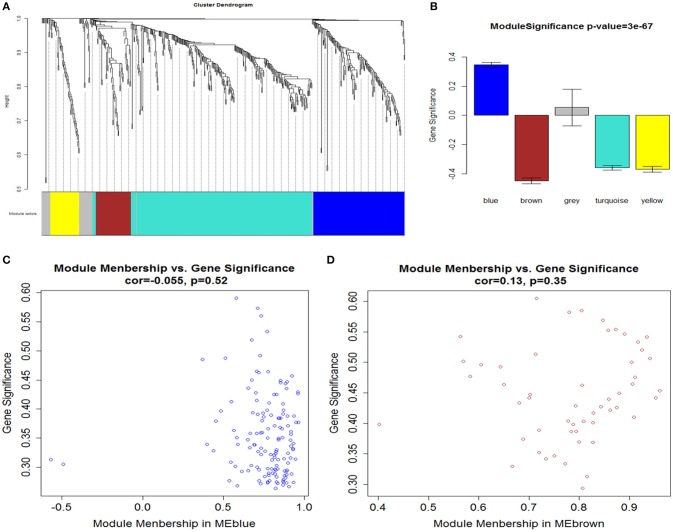
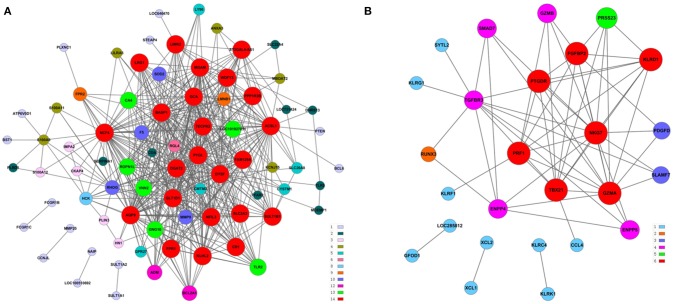
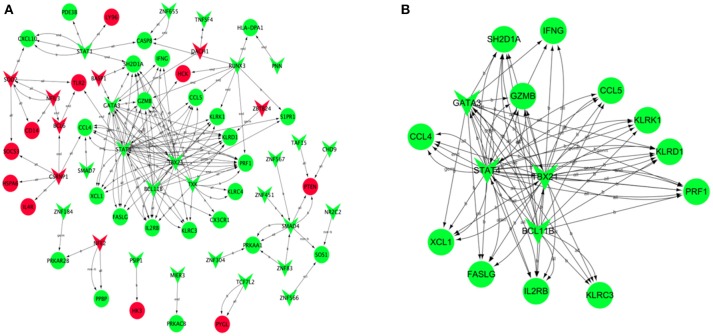
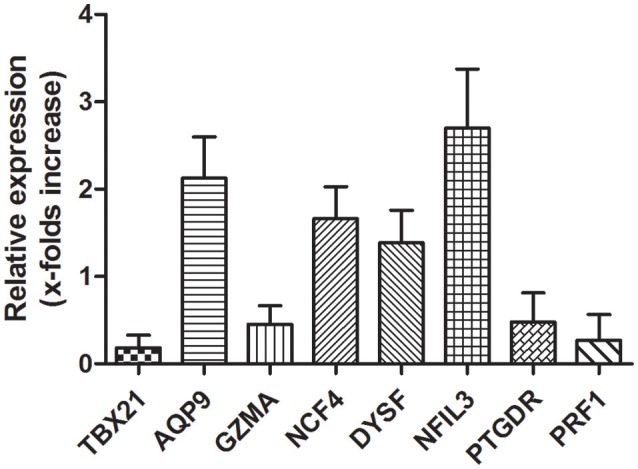
Acute myocardial infarction (AMI) is a severe cardiovascular disease that is a serious threat to human life. However, the specific diagnostic biomarkers have not been fully clarified and candidate regulatory targets for AMI have not been identified. In order to explore the potential diagnostic biomarkers and possible regulatory targets of AMI, we used a network analysis-based approach to analyze microarray expression profiling of peripheral blood in patients with AMI. The significant differentially-expressed genes (DEGs) were screened by Limma and constructed a gene function regulatory network (GO-Tree) to obtain the inherent affiliation of significant function terms. The pathway action network was constructed, and the signal transfer relationship between pathway terms was mined in order to investigate the impact of core pathway terms in AMI. Subsequently, constructed the transcription regulatory network of DEGs. Weighted gene co-expression network analysis (WGCNA) was employed to identify significantly altered gene modules and hub genes in two groups. Subsequently, the transcription regulation network of DEGs was constructed. We found that specific gene modules may provide a better insight into the potential diagnostic biomarkers of AMI. Our findings revealed and verified that NCF4, AQP9, NFIL3, DYSF, GZMA, TBX21, PRF1 and PTGDR genes by RT-qPCR. TBX21 and PRF1 may be potential candidates for diagnostic biomarker and possible regulatory targets in AMI.
Keywords: acute myocardial infarction; biomarkers; hub genes; inflammation; systems biology.
Figures
Similar articles
-
Identification and exploration of novel M2 macrophage-related biomarkers in the development of acute myocardial infarction.Front Cardiovasc Med. 2022 Nov 10;9:974353. doi: 10.3389/fcvm.2022.974353. eCollection 2022. Front Cardiovasc Med. 2022. PMID: 36440001 Free PMC article.
-
Potential biomarkers of acute myocardial infarction based on co-expression network analysis.Exp Ther Med. 2022 Feb;23(2):162. doi: 10.3892/etm.2021.11085. Epub 2021 Dec 21. Exp Ther Med. 2022. PMID: 35069843 Free PMC article.
-
Identification of immune-related biomarkers co-occurring in acute ischemic stroke and acute myocardial infarction.Front Neurol. 2023 Aug 17;14:1207795. doi: 10.3389/fneur.2023.1207795. eCollection 2023. Front Neurol. 2023. PMID: 37662030 Free PMC article.
-
Systematic Bioinformatics Analysis Based on Public and Second-Generation Sequencing Transcriptome Data: A Study on the Diagnostic Value and Potential Mechanisms of Immune-Related Genes in Acute Myocardial Infarction.Front Cardiovasc Med. 2022 Apr 14;9:863248. doi: 10.3389/fcvm.2022.863248. eCollection 2022. Front Cardiovasc Med. 2022. PMID: 35498008 Free PMC article.
-
Emerging Biomarkers in Bladder Cancer Identified by Network Analysis of Transcriptomic Data.Front Oncol. 2018 Oct 12;8:450. doi: 10.3389/fonc.2018.00450. eCollection 2018. Front Oncol. 2018. PMID: 30370253 Free PMC article. Review.
Cited by
-
Identification of key gene modules and pathways of human platelet transcriptome in acute myocardial infarction patients through co-expression network.Am J Transl Res. 2021 Apr 15;13(4):3890-3905. eCollection 2021. Am J Transl Res. 2021. PMID: 34017580 Free PMC article.
-
Construction of Novel Gene Signature-Based Predictive Model for the Diagnosis of Acute Myocardial Infarction by Combining Random Forest With Artificial Neural Network.Front Cardiovasc Med. 2022 May 25;9:876543. doi: 10.3389/fcvm.2022.876543. eCollection 2022. Front Cardiovasc Med. 2022. PMID: 35694667 Free PMC article.
-
Integration of machine learning to identify diagnostic genes in leukocytes for acute myocardial infarction patients.J Transl Med. 2023 Oct 27;21(1):761. doi: 10.1186/s12967-023-04573-x. J Transl Med. 2023. PMID: 37891664 Free PMC article.
-
Identification of differentially expressed genes, lncRNAs and miRNAs which are associated with tumor malignant phenotypes in hepatoblastoma patients.Oncotarget. 2017 Oct 31;8(57):97554-97564. doi: 10.18632/oncotarget.22181. eCollection 2017 Nov 14. Oncotarget. 2017. PMID: 29228631 Free PMC article.
-
Identification of monocyte-associated genes as predictive biomarkers of heart failure after acute myocardial infarction.BMC Med Genomics. 2021 Feb 9;14(1):44. doi: 10.1186/s12920-021-00890-6. BMC Med Genomics. 2021. PMID: 33563285 Free PMC article.
References
LinkOut - more resources
Full Text Sources
Other Literature Sources
Research Materials