. 2016 Dec 16:7:1966.
doi: 10.3389/fmicb.2016.01966. eCollection 2016.

Inoculation of Soil with Plant Growth Promoting Bacteria Producing 1-Aminocyclopropane-1-Carboxylate Deaminase or Expression of the Corresponding acdS Gene in Transgenic Plants Increases Salinity Tolerance in Camelina sativa

Affiliations

Inoculation of Soil with Plant Growth Promoting Bacteria Producing 1-Aminocyclopropane-1-Carboxylate Deaminase or Expression of the Corresponding acdS Gene in Transgenic Plants Increases Salinity Tolerance in Camelina sativa

Zohreh Heydarian et al. Front Microbiol. .

Abstract

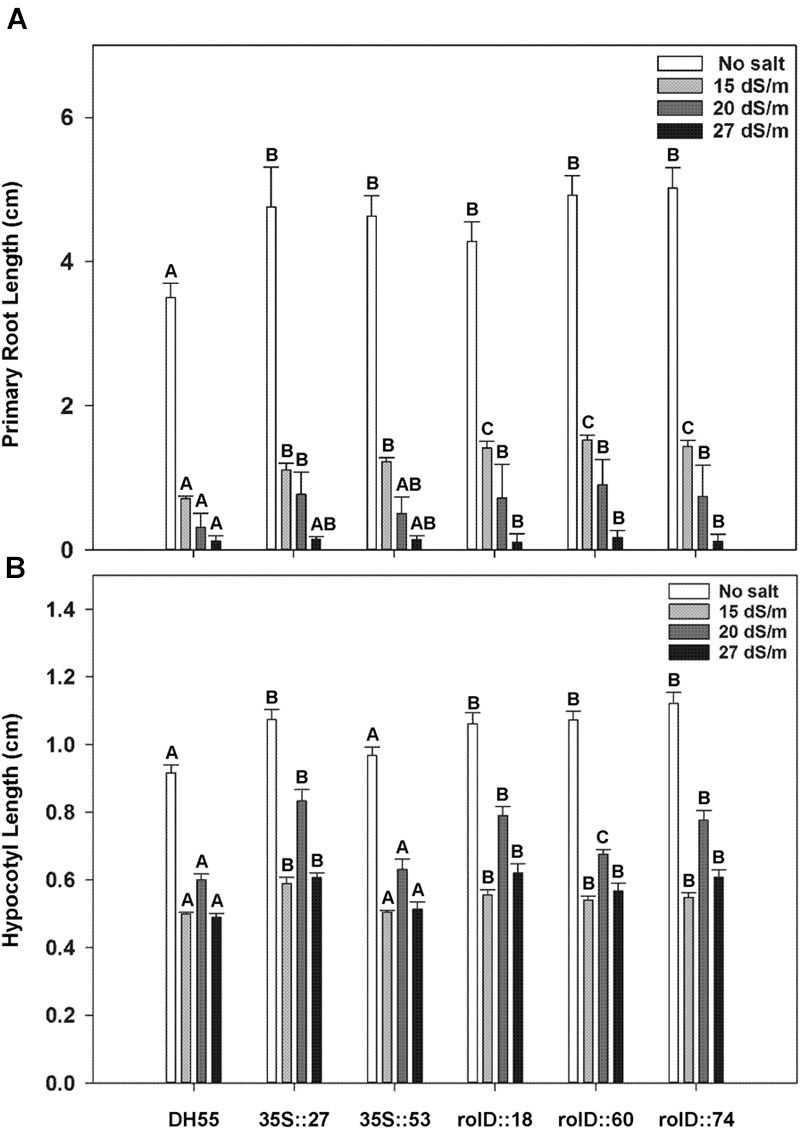
Camelina sativa (camelina) is an oilseed crop touted for use on marginal lands; however, it is no more tolerant of soil salinity than traditional crops, such as canola. Plant growth-promoting bacteria (PGPB) that produce 1-aminocyclopropane-1-carboxylate deaminase (ACC deaminase) facilitate plant growth in the presence of abiotic stresses by reducing stress ethylene. Rhizospheric and endophytic PGPB and the corresponding acdS- mutants of the latter were examined for their ability to enhance tolerance to salt in camelina. Stimulation of growth and tolerance to salt was correlated with ACC deaminase production. Inoculation of soil with wild-type PGPB led to increased shoot length in the absence of salt, and increased seed production by approximately 30-50% under moderately saline conditions. The effect of ACC deaminase was further examined in transgenic camelina expressing a bacterial gene encoding ACC deaminase (acdS) under the regulation of the CaMV 35S promoter or the root-specific rolD promoter. Lines expressing acdS, in particular those using the rolD promoter, showed less decline in root length and weight, increased seed production, better seed quality and higher levels of seed oil production under salt stress. This study clearly demonstrates the potential benefit of using either PGPB that produce ACC deaminase or transgenic plants expressing the acdS gene under the control of a root-specific promoter to facilitate plant growth, seed production and seed quality on land that is not normally suitable for the majority of crops due to high salt content.

Keywords: 1-aminocyclopropane-1-carboxylate deaminase; Camelina sativa; plant growth promoting bacteria; salinity tolerance; transgenic plants.


Figures

FIGURE 1
FIGURE 1
The effect of soil inoculation with plant growth-promoting bacteria (PGPB) on the shoot length of camelina plants grown in the absence, or presence of, salt (15 and 20 dSm-1). Soil was treated with buffer (control), Pseudomonas putida UW4, P. migulae 8R6 or its acdS mutant 8R6M, P. fluorescens YsS6 or its acdS mutant YsS6M. Salt was applied 20 days after sowing. Error bars indicate standard error (n = 15). A two-way ANOVA and Tukey post-test were used to detect significant differences between groups. Asterisks () above bars indicate values that are significantly different (p < 0.05) from the control on days when measurements were taken.
FIGURE 2
FIGURE 2
The effect of soil inoculation with PGPB on root development of camelina plants grown in the absence, or presence of, salt (15 and 20 dSm-1). Soil was treated with buffer (control), P. putida UW4, P. migulae 8R6 or its acdS mutant 8R6M, P. fluorescens YsS6 or its acdS mutant YsS6M. Salt was applied 20 days after sowing. Panels show root length (A), root dry weight (B), and ratio of root weight to shoot weight 41 days after sowing (C). Error bars indicate standard error (n = 15). A two-way ANOVA and Tukey post-test were used to detect significant differences between groups. Capital letters above bars indicate values that are significantly different (p < 0.05) between treatments for each salt concentration.
FIGURE 3
FIGURE 3
The effect of soil inoculation with PGPB on seed production of camelina plants grown in the absence, or presence of, salt (15 dSm-1). (A) Shows the amount of seeds produced per plant and (B) the weight of 100 seeds. Error bars indicate standard error (n = 25 plants in control and 10 plants under moderate salt stress). A two- way ANOVA and Tukey post-test were used to detect significant differences between groups. Asterisks () above bars indicate values that are significantly different (p < 0.05) from the control.
FIGURE 4
FIGURE 4
The effect of acdS expression on the rate of germination of camelina seeds in the absence, or presence of, salt (15 and 20 dSm-1). Lines tested include wild-type C. sativa DH55 or independent, single insert, homozygous transgenic lines expressing the acdS gene under the control of the root-specific rolD promoter or the constitutive CaMV 35S promoter. Error bars indicate standard error [n = 60 seeds divided in three plates (20 seeds/ plate)]. A two- way ANOVA and Tukey post-test were used to detect significant differences between groups. Asterisks () indicate control (DH55) values that are significantly different (p < 0.05) from the transgenic lines.
FIGURE 5
FIGURE 5
Germination of camelina seeds in the absence of, or presence of, salt (15 dSm-1). Lines tested include wild-type C. sativa DH55 or independent, single insert, homozygous transgenic lines expressing the acdS gene under the control of the root-specific rolD promoter or the constitutive CaMV 35S promoter. The grid in the top left panel applies to all panels in the figure.
FIGURE 6
FIGURE 6
The effect of acdS expression on hypocotyl and primary root length during germination of camelina seeds in the absence, or presence of, salt (15, 20, and 27 dSm-1). Lines tested include wild-type C. sativa DH55 or independent, single insert, homozygous transgenic lines expressing the acdS gene under the control of the root-specific rolD promoter or the constitutive CaMV 35S promoter. (A) Shows primary root length and (B) hypocotyl length on day 6. Error bars indicate standard error [60 seeds divided in three plates (20 seeds/plate)]. A two-way ANOVA and Tukey post-test were used to detect significant differences between groups. Capital letters above bars indicate values that are significantly different (p < 0.05) between lines for each salt concentration.
FIGURE 7
FIGURE 7
The effect of acdS expression on the seedling survival in the presence of salt (20 dSm-1). Lines tested include wild-type C. sativa DH55 or independent, single insert, homozygous transgenic lines expressing the acdS gene under the control of the root-specific rolD promoter or the constitutive CaMV 35S promoter. Error bars indicate standard error [60 seeds divided in three plates (20 seeds/plate)]. ANOVA and Tukey post-test were used to detect significant differences between groups. Asterisks() indicate control (DH55) values that are significantly different (p < 0.05) from the transgenic lines.
FIGURE 8
FIGURE 8
Growth and survival of camelina seedlings in the presence of salt (20 dSm-1). Lines tested include wild-type C. sativa DH55 or independent, single insert, homozygous transgenic lines expressing the acdS gene under the control of the root-specific rolD promoter or the constitutive CaMV 35S promoter. The grid in the top panel applies to all panels in the figure.
FIGURE 9
FIGURE 9
The effect of acdS expression on shoot development of camelina plants grown in the absence, or presence of, salt (15 and 20 dSm-1). Lines tested include wild-type C. sativa DH55 or independent, single insert, homozygous transgenic lines expressing the acdS gene under the control of the root-specific rolD promoter or the constitutive CaMV 35S promoter. Panels show shoot length, shoot fresh weight, and shoot dry weight 41 days after sowing. Error bars indicate standard error (n = 10). A two- way ANOVA and Tukey post-test were used to detect significant differences between groups. Capital letters above bars indicate values that are significantly different (p < 0.05) between lines for each salt concentration.
FIGURE 10
FIGURE 10
The effect of acdS expression on root development of camelina plants grown in the absence, or presence of, salt (15 and 20 dSm-1). Lines tested include wild-type C. sativa DH55 or independent, single insert, homozygous transgenic lines expressing the acdS gene under the control of the root-specific rolD promoter or the constitutive CaMV 35S promoter. Panels show root length (A), root length reduction (B), root dry weight (C), root dry weight reduction (D), and ratio of root weight to shoot weight (E) 41 days after sowing. Error bars indicate standard error (n = 10). A two-way ANOVA and Tukey post-test were used to detect significant differences between groups. Capital letters above bars indicate values that are significantly different (p < 0.05) between lines for each salt concentration.
FIGURE 11
FIGURE 11
The effect of acdS expression on seed production of camelina plants grown in the absence of, or presence of, salt (15 dSm-1). Lines tested include wild-type C. sativa DH55 or independent, single insert, homozygous transgenic lines expressing the acdS gene under the control of the root-specific rolD promoter or the constitutive CaMV 35S promoter. Error bars indicate standard error (n = 10 plants in control, five plants under moderate and four plants under severe salt stress). A two- way ANOVA and Tukey post-test were used to detect significant differences between groups. Capital letters above bars indicate values that are significantly different (p < 0.05) between lines for each salt concentration.
FIGURE 12
FIGURE 12
The effect of acdS expression on seed glucosinolate levels in camelina plants grown in the absence of, or presence of, salt (15 and 20 dSm-1). Lines tested include wild-type C. sativa DH55 and transgenic lines expressing the acdS gene under the control of theroot-specific rolD promoter or the constitutive CaMV 35S promoter. Error bars indicate the range of two pools of seed each from four plants. Panels show total glucosinolates (GS), 9-(methylsulfinyl)nonyl-glucosinolate (9M-GS), 10-(methylsulfinyl)decyl-glucosinolate (10M-GS), and 11-(methylsulfinyl)undecyl-glucosinolate (11M-GS).
FIGURE 13
FIGURE 13
The effect of acdS expression on seed oil and fatty acid content in camelina plants grown in the absence of, or presence of, salt (15 and 20 dSm-1). Lines tested include wild-type C. sativa DH55 and transgenic lines expressing the acdS gene under the control of the root-specific rolD promoter or the constitutive CaMV 35S promoter. Error barsindicate the range of two pools of seed each from four plants. Upper panel shows total oil content and the lower panels show fatty acid levelsunder various salt conditions. Fatty acids are as follows: myristic acid (14:0), palmitic acid (16:0), palmitoleic acid (16:1), stearic acid (18:0), oleic acid (18:1), linoleic acid (18:2), α-linolenic acid (18:3), arachidic acid (20:0), 11-eicosenoic acid (20:1), 11,14-eicosadienoic acid (20:2), behenic acid (22:0), erucicacid (22:1), 13,16-docosadienoic acid (22:2), lignoceric acid (24:0), and nervonic acid (24:1).

Similar articles

Cited by

References

    1. Abeles F. B., Morgan P. W., Saltveit M. E., Jr. (1992). Ethylene in Plant Biology (Second Edition). New York, NY: Academic Press.
    1. Achard P., Cheng H., De Grauwe L., Decat J., Schoutteten H., Moritz T., et al. (2006). Integration of plant responses to environmentally activated phytohormonal signals. Science 311 91–94. 10.1126/science.1118642 - DOI - PubMed
    1. Ali S., Charles T. C., Glick B. R. (2012). Delay of flower senescence by bacterial endophytes expressing 1-aminocyclopropane-1-carboxylate deaminase. J. Appl. Microbiol. 113 1139–1144. 10.1111/j.1365-2672.2012.05409.x - DOI - PubMed
    1. Ali S., Charles T. C., Glick B. R. (2014). Amelioration of high salinity stress damage by plant growth-promoting bacterial endophytes that contain ACC deaminase. Plant Physiol. Biochem. 80 160–167. 10.1016/j.plaphy.2014.04.003 - DOI - PubMed
    1. American Oil Chemists’ Society (2009). Determination of Saturated, cis-Monounsaturated, and cis-Polyunsaturated Fatty Acids in Marine and Other Oils Containing Long Chain Polyunsaturated Fatty Acids (PUFAs) by Capillary GLC. AOCS Official Method Ce li-07. Urbana, IL: AOCS.

LinkOut - more resources