. 2016 Dec 9:7:1976.
doi: 10.3389/fmicb.2016.01976. eCollection 2016.

Microbial Community Structure and Function of Soil Following Ecosystem Conversion from Native Forests to Teak Plantation Forests

Affiliations

Microbial Community Structure and Function of Soil Following Ecosystem Conversion from Native Forests to Teak Plantation Forests

Vidya de Gannes et al. Front Microbiol. .

Abstract

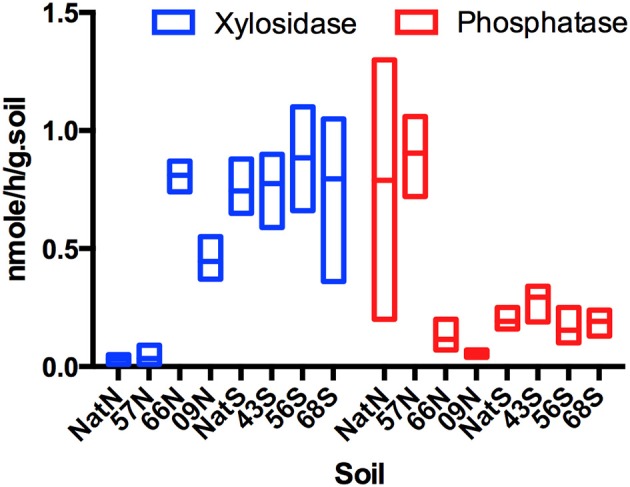
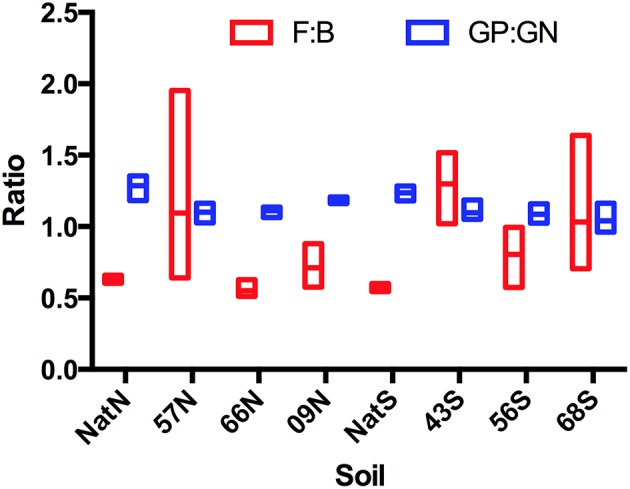
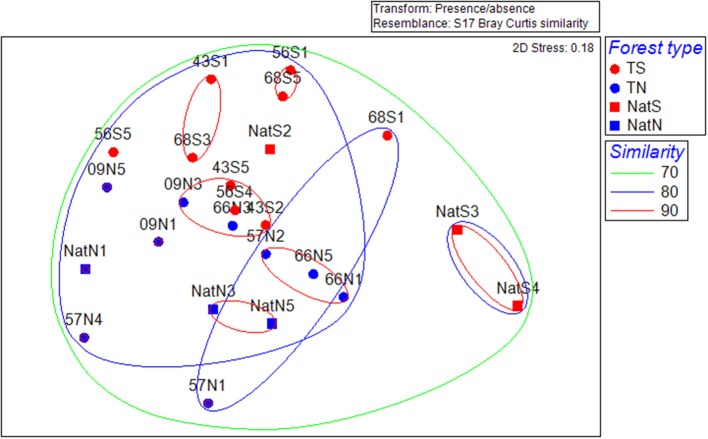
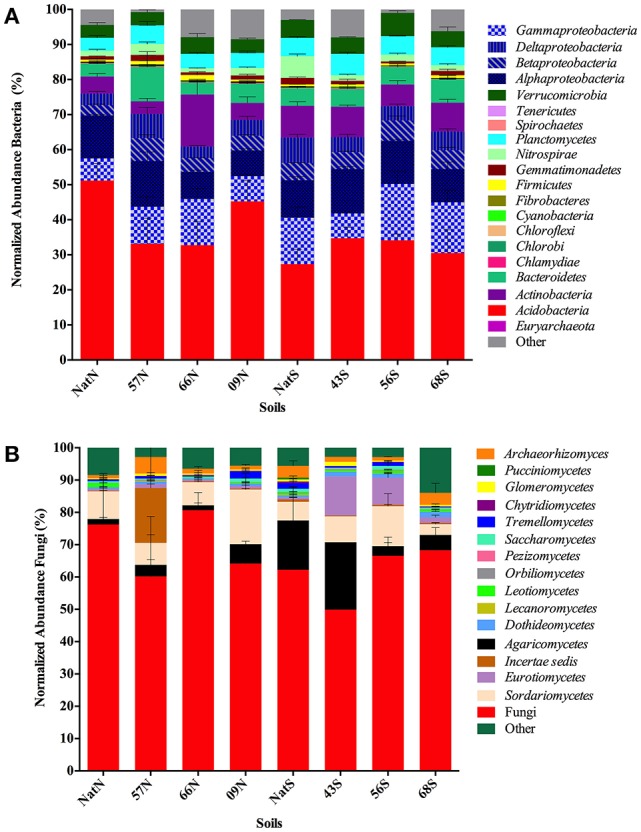
Soil microbial communities can form links between forest trees and functioning of forest soils, yet the impacts of converting diverse native forests to monoculture plantations on soil microbial communities are limited. This study tested the hypothesis that conversion from a diverse native to monoculture ecosystem would be paralleled by a reduction in the diversity of the soil microbial communities. Soils from Teak (Tectona grandis) plantations and adjacent native forest were examined at two locations in Trinidad. Microbial community structure was determined via Illumina sequencing of bacterial 16S rRNA genes and fungal internal transcribed spacer (ITS) regions, and by phospholipid fatty acid (PLFA) analysis. Functional characteristics of microbial communities were assessed by extracellular enzyme activity (EEA). Conversion to Teak plantation had no effect on species richness or evenness of bacterial or fungal communities, and no significant effect on EEA. However, multivariate analyses (nested and two-way crossed analysis of similarity) revealed significant effects (p < 0.05) of forest type (Teak vs. native) upon the composition of the microbial communities as reflected in all three assays of community structure. Univariate analysis of variance identified two bacterial phyla that were significantly more abundant in the native forest soils than in Teak soils (Cyanobacteria, p = 0.0180; Nitrospirae, p = 0.0100) and two more abundant in Teak soils than in native forest (candidate phyla TM7, p = 0.0004; WS6, p = 0.044). Abundance of an unidentified class of arbuscular mycorrhizal fungi (AMF) was significantly greater in Teak soils, notable because Teak is colonized by AMF rather than by ectomycorrihzal fungi that are symbionts of the native forest tree species. In conclusion, microbial diversity indices were not affected in the conversion of native forest to teak plantation, but examination of specific bacterial taxa showed that there were significant differences in community composition.

Keywords: and Illumina; archaea; bacteria; forest; fungi; soil.


Figures

Figure 1
Figure 1
Box Plot of xylosidase and phosphatase activities (nmole/h/gram.Soil) across forest soils. Letters indicate forest soils sample sites followed by year of establishment and are abbreviated as: N, North; S, South and Nat, Native.
Figure 2
Figure 2
PLFA-based community structure illustrating ratios of microbial guilds. Abbreviations represent: year of establishment; Nat, Native; North, N and S, South; F, fungi, B, bacteria; GP, gram positive bacteria; GN, gram negative bacteria (GP:GN).
Figure 3
Figure 3
Non-metric multidimensional scaling ordinations for separation of microbial community structure by location based on PLFA data. T, Teak; S, South; N, North; Nat, Native. Numbers indicate replicate number. Dotted lines are percent similarity contours derived from cluster analysis.
Figure 4
Figure 4
(A) Comprehensive view of the sequence content of forest soil libraries for prokaryotes. Segments composing each bar are mean number of sequences in the indicated taxa normalized to the total number of sequences in each library. Standard error of each mean is indicated by lines within each segment. Letters indicate forest soils sample sites followed by year of establishment and are abbreviated as: T, Teak; S, South; N, North; Nat, Native. (B) Comprehensive view of the sequence content of forest soil libraries for Fungi. Segments composing each bar are mean number of sequences in the indicated taxa normalized to the total number of sequences in each library. Standard error of each mean is indicated by lines within each segment. Letters indicate forest soils sample sites followed by year of establishment and are abbreviated as: T, Teak; S, South; N, North; Nat, Native.
Figure 5
Figure 5
(A) Alpha-diversity characteristics visualized on Whittaker plot for bacterial community, where line slopes reflect species (OTU) evenness and line lengths indicate OTU richness. Letters indicate forest soils sample sites followed by year of establishment and are abbreviated as: T, Teak; S, South; N, North; Nat, Native. The values plotted are the average fractional abundance in each library. All values are plotted but some overlap and hence are invisible. (B) Whittaker plots illustrating domination of all fungal communities by a single OTU. Letters indicate forest soils sample sites followed by year of establishment and are abbreviated as: T, Teak; S, South; N, North; Nat, Native. The values plotted are the average fractional abundance in each library. In both panels relative abundance is the fraction of all sequences in a given library that were represented by a single OTU.
Figure 6
Figure 6
Non-metric multidimensional scaling ordinations of the bacterial community data. Dotted lines are percent similarity contours. Abbreviations are as in Figure 3.
Figure 7
Figure 7
Non-metric multidimensional scaling ordinations of the fungal community data. Dotted lines are percent similarity contours. Abbreviations are as in Figure 3.

Similar articles

Cited by

References

    1. Angel R., Soares M. I. M., Ungar E. D., Gillor O. (2010). Biogeography of soil archaea and bacteria along a steep precipitation gradient. ISME J. 4, 553–563. 10.1038/ismej.2009.136 - DOI - PubMed
    1. Augusto L., Ranger J., Binkley D., Rothe A. (2002). Impact of several common tree species of European temperate forests on soil fertility. Ann. For. Sci. 59, 233–253. 10.1051/forest:2002020 - DOI
    1. Bailey V. L., Fansler S. J., Stegen J. C., McCue L. A. (2013). Linking microbial community structure to B-glucosidic functions in soil aggregates. ISME J. 7, 2044–2053. 10.1038/ismej.2013.87 - DOI - PMC - PubMed
    1. Beare M. H., Parmelee R. W., Hendrix P. F., Cheng W., Coleman D. C., Crossley D. A., Jr. (1992). Microbial and faunal interactions and effects on litter nitrogen and decomposition in agroecosystems. Ecol. Monogr. 62, 569–591. 10.2307/2937317 - DOI
    1. Benjamini Y., Hochberg Y. (1995). Controlling the false discovery rate: a practical and powerful approach to multiple testing. J. R. Stat. Soc. B 57, 280–300.

LinkOut - more resources