. 2016 Dec 14:7:590.
doi: 10.3389/fimmu.2016.00590. eCollection 2016.

Plasmacytoid Dendritic Cells Respond Directly to Apoptotic Cells by Secreting Immune Regulatory IL-10 or IFN-α

Affiliations

Plasmacytoid Dendritic Cells Respond Directly to Apoptotic Cells by Secreting Immune Regulatory IL-10 or IFN-α

Joanne Simpson et al. Front Immunol. .

Abstract

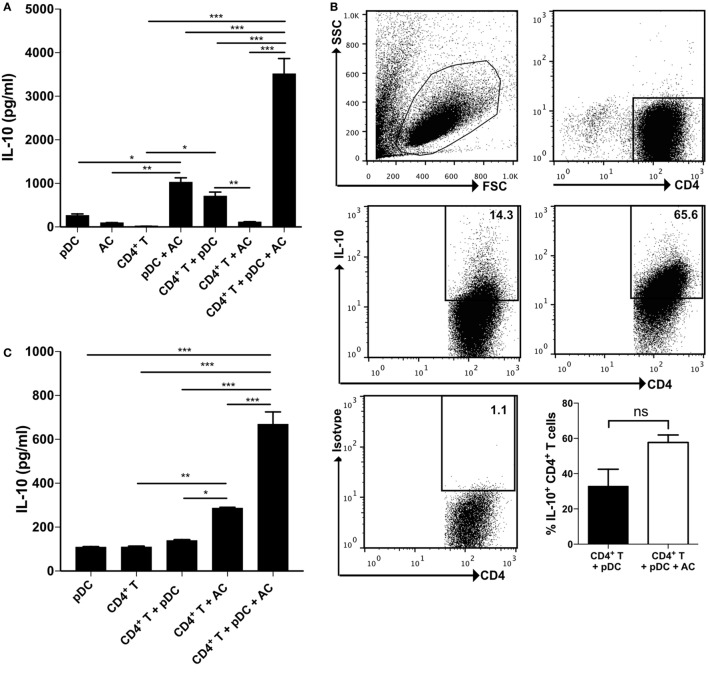
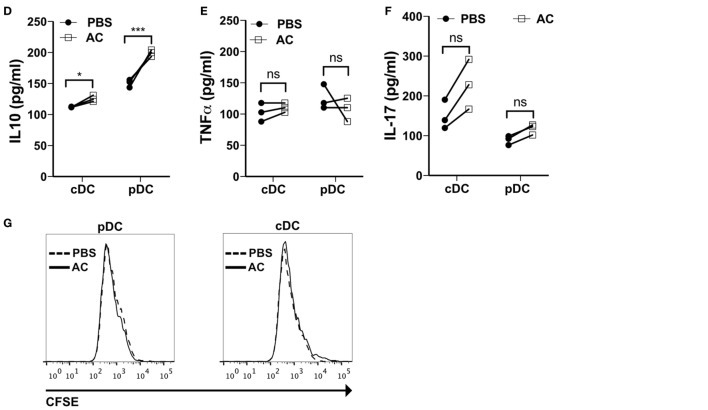
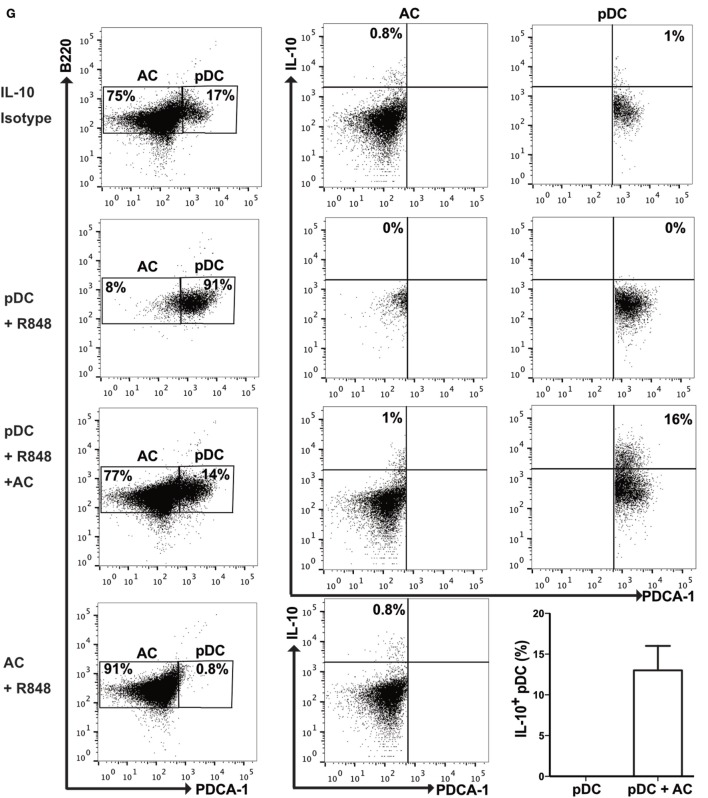
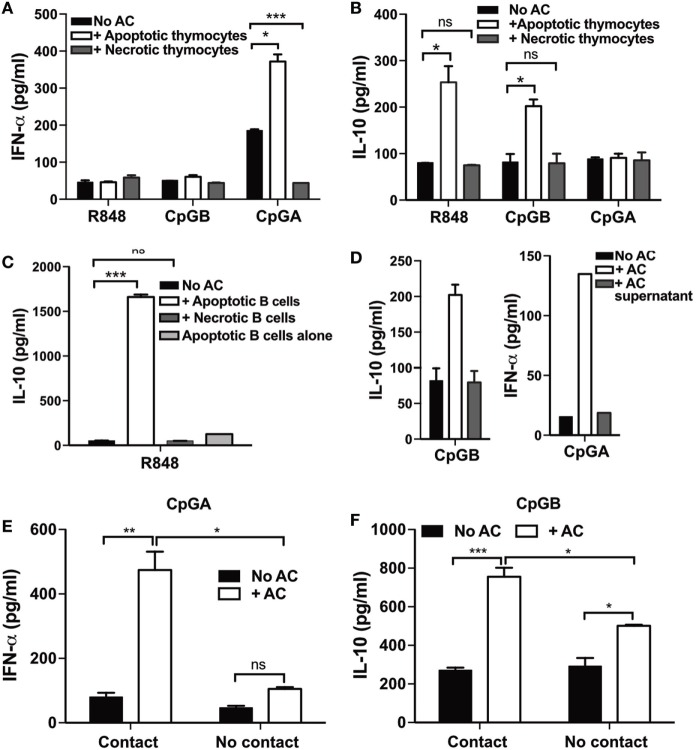
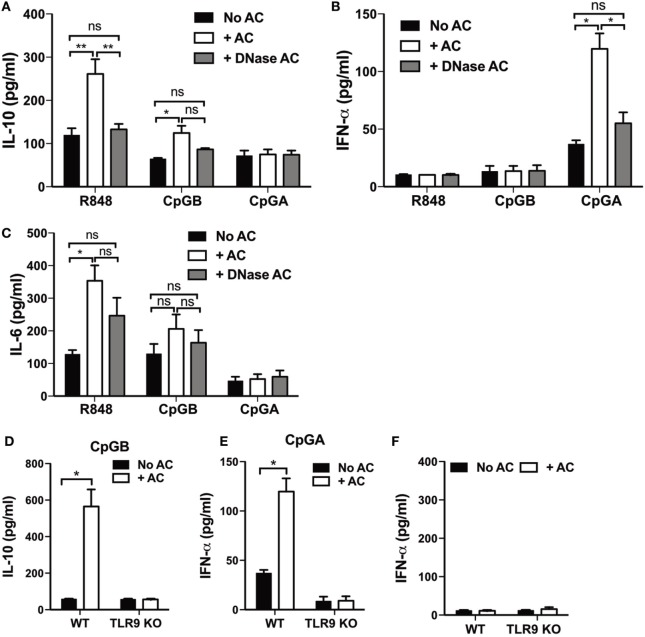
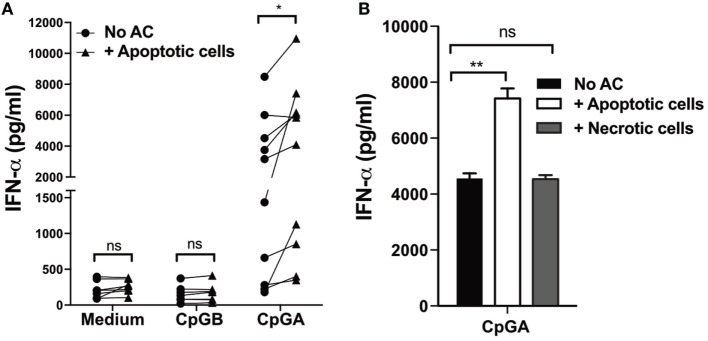
Plasmacytoid dendritic cells (pDCs) play a pivotal role in driving the autoimmune disease systemic lupus erythematosus, via the secretion of IFN-α in response to nuclear self-antigens complexed with autoantibodies. Apoptotic cells, generated at sites of inflammation or secondary lymphoid organs, are exposed to activated pDCs and also express the same nuclear antigens on their cell surface. Here, we show that in the absence of autoantibodies, activated pDCs directly respond to apoptotic cell-expressed chromatin complexes by secreting IL-10 and IL-6, which also induces T cells to secrete IL-10. Conversely, when activated by the viral mimetic CpG-A, apoptotic cells enhance their secretion of IFN-α. This study demonstrates that activated pDCs respond directly to apoptotic cells and may maintain tolerance via IL-10, or promote inflammation through secretion of IFN-α, depending on the inflammatory context.

Keywords: IL-10; apoptosis; apoptotic cell; plasmacytoid dendritic cell; toll-like receptor.


Figures

Figure 1
Figure 1
Plasmacytoid dendritic cells (pDCs) that have encountered apoptotic cells in vivo induce a population of IL-10 secreting CD4+ T cells. (A) CD4+ T cells were cultured with R848, pDCs, and apoptotic B cells in various combinations. After 7 days, IL-10 production was measured by ELISA. Data are shown as the mean + SEM of three independent experiments. *p < 0.05; **p < 0.01; and ***p < 0.001, as determined by one-way ANOVA followed by Tukey’s multiple comparison test. (B) The proportion of CD4+ T cells producing IL-10 in response to R848 and pDCs with and without apoptotic B cells was quantified by IL-10 secretion assay. Data are shown as the mean + SEM of three independent experiments, with representative FACS plots from one of three experiments. **p < 0.01, as determined by Student’s t-test. (C) BALB/C CD4+ T cells were cultured with R848, C57BL/6 pDCs, and C57BL/6 apoptotic B cells in various combinations. IL-10 production was measured after 3 days. *p < 0.05; **p < 0.01; and ***p < 0.001, as determined by one-way ANOVA followed by Tukey’s multiple comparison test. (D) IL-10, (E) TNF-α, and (F) IL-17 production by naïve DO11.10 CD4+ T cells was measured following 72 h in culture with OVA323–339 peptide and pDCs, or conventional dendritic cells (cDCs) that were isolated from the spleen and inguinal lymph nodes of mice that were immunized for 7 days with OVA/CFA and vehicle control (PBS), or apoptotic thymocytes (AC). Each symbol represents pooled data from three independent experiments consisting of four mice per group. *p < 0.05; ***p < 0.001; and ns not significant, as determined by paired Student’s t-test. (G) DO11.10 CD4+ T cell proliferation was measured following 72 h in culture with OVA323–339 peptide and pDCs, or cDCs. FACS plots represent data pooled from four mice. See also Figure S1C in Supplementary Material.
Figure 1
Figure 1
Plasmacytoid dendritic cells (pDCs) that have encountered apoptotic cells in vivo induce a population of IL-10 secreting CD4+ T cells. (A) CD4+ T cells were cultured with R848, pDCs, and apoptotic B cells in various combinations. After 7 days, IL-10 production was measured by ELISA. Data are shown as the mean + SEM of three independent experiments. *p < 0.05; **p < 0.01; and ***p < 0.001, as determined by one-way ANOVA followed by Tukey’s multiple comparison test. (B) The proportion of CD4+ T cells producing IL-10 in response to R848 and pDCs with and without apoptotic B cells was quantified by IL-10 secretion assay. Data are shown as the mean + SEM of three independent experiments, with representative FACS plots from one of three experiments. **p < 0.01, as determined by Student’s t-test. (C) BALB/C CD4+ T cells were cultured with R848, C57BL/6 pDCs, and C57BL/6 apoptotic B cells in various combinations. IL-10 production was measured after 3 days. *p < 0.05; **p < 0.01; and ***p < 0.001, as determined by one-way ANOVA followed by Tukey’s multiple comparison test. (D) IL-10, (E) TNF-α, and (F) IL-17 production by naïve DO11.10 CD4+ T cells was measured following 72 h in culture with OVA323–339 peptide and pDCs, or conventional dendritic cells (cDCs) that were isolated from the spleen and inguinal lymph nodes of mice that were immunized for 7 days with OVA/CFA and vehicle control (PBS), or apoptotic thymocytes (AC). Each symbol represents pooled data from three independent experiments consisting of four mice per group. *p < 0.05; ***p < 0.001; and ns not significant, as determined by paired Student’s t-test. (G) DO11.10 CD4+ T cell proliferation was measured following 72 h in culture with OVA323–339 peptide and pDCs, or cDCs. FACS plots represent data pooled from four mice. See also Figure S1C in Supplementary Material.
Figure 2
Figure 2
Apoptotic cells augment differential cytokine production by plasmacytoid dendritic cells (pDCs) depending on the toll-like receptor stimulus. pDCs were unstimulated, or stimulated with R848, CpG-B, or CpG-A, and cultured alone (No AC), or with apoptotic thymocytes (+ AC). (A) IL-10, (B) IL-6, (C) TNF-α, (D) IL-12, and (E) IFN-α protein were measured in cell supernatants after 72 h. (F) Cytokine production by apoptotic thymocytes cultured alone with and without R848, CpG-B, or CpG-A was measured after 72 h. Data are presented as the mean of three to eight independent experiments. Error bars represent SEM. *p < 0.05; **p < 0.01; ***p < 0.001; and ns not significant, as determined by paired Student’s t-test. (G) Expression of intracellular IL-10 was detected in pDCs (PDCA+ B220+) that were cultured for 72 h with R848 alone and with apoptotic B cells (+ AC), and apoptotic B cells with R848 alone. FACS plots represent one of three independent experiments. Bars are the mean + SEM of three independent experiments. See also Figures S1A,D–H and S2 in Supplementary Material.
Figure 2
Figure 2
Apoptotic cells augment differential cytokine production by plasmacytoid dendritic cells (pDCs) depending on the toll-like receptor stimulus. pDCs were unstimulated, or stimulated with R848, CpG-B, or CpG-A, and cultured alone (No AC), or with apoptotic thymocytes (+ AC). (A) IL-10, (B) IL-6, (C) TNF-α, (D) IL-12, and (E) IFN-α protein were measured in cell supernatants after 72 h. (F) Cytokine production by apoptotic thymocytes cultured alone with and without R848, CpG-B, or CpG-A was measured after 72 h. Data are presented as the mean of three to eight independent experiments. Error bars represent SEM. *p < 0.05; **p < 0.01; ***p < 0.001; and ns not significant, as determined by paired Student’s t-test. (G) Expression of intracellular IL-10 was detected in pDCs (PDCA+ B220+) that were cultured for 72 h with R848 alone and with apoptotic B cells (+ AC), and apoptotic B cells with R848 alone. FACS plots represent one of three independent experiments. Bars are the mean + SEM of three independent experiments. See also Figures S1A,D–H and S2 in Supplementary Material.
Figure 3
Figure 3
Direct contact with whole apoptotic cells, but not necrotic cells, induces cytokine production by plasmacytoid dendritic cells (pDCs). (A) IFN-α and (B) IL-10 production was measured 72 h after R848-, CpG-B-, or CpG-A-stimulated pDCs were cocultured with apoptotic, or secondarily necrotic thymocytes. (C) IL-10 production by R848-stimulated pDCs was measured 3 days after culture alone and with apoptotic, or secondarily necrotic B cells. IL-10 secretion by R848-stimulated apoptotic B cells alone was also measured. (D) pDCs activated by CpG-B and CpG-A were cultured for 72 h with the cell-free supernatant from apoptotic thymocytes and then IL-10 and IFN-α production was measured, respectively. (E) IFN-α and (F) IL-10 secretion was quantified 72 h following the coculture of CpG-A and CpG-B, respectively, activated pDCs with apoptotic cells together in the well (contact) or separated using a transwell insert (No contact). Data are shown as the mean of three independent experiments with error bars representing SEM. *p < 0.05; **p < 0.01; ***p < 0.001; and ns not significant, as determined by one-way ANOVA (A–D) and two-way ANOVA (E–F).
Figure 4
Figure 4
IL-10 production by plasmacytoid dendritic cells (pDCs) is dependent on apoptotic cell-derived DNA complexes. (A) IL-10, (B) IFN-α, and (C) IL-6 production was measured 72 h after pDCs were cultured with R848, CpG-B, or CpG-A, in the presence and absence of apoptotic thymocytes (+ AC), or DNase-treated apoptotic thymocytes (+ DNase AC). Data are shown as the mean + SEM of three to eight independent experiments. *p < 0.05; **p < 0.01; and ns not significant, as determined by one-way ANOVA followed by Tukey’s multiple comparison test. (D) IL-10 and (E) IFN-α secretion was quantified following culture of pDCs isolated from wild type C57BL/6 and TLR9-deficient (TLR9 KO) mice with CpG-B and CpG-A, respectively, with and without apoptotic thymocytes. Data are the mean + SEM of (D,E) eight and (F) three independent experiments. *p < 0.05, as determined by paired Student’s t-test.
Figure 5
Figure 5
IFN-α production by human plasmacytoid dendritic cells (pDCs) stimulated with CpG-A is enhanced by apoptotic cells, but not secondary necrotic cells. (A) Peripheral blood mononuclear cells (PBMCs) isolated from healthy volunteers were cultured for 72 h with and without apoptotic cells in culture medium alone, or in the presence of CpG-B, or CpG-A, after which IFN-α in the supernatants was measured. Each symbol represents an individual healthy blood donor and data were collected from at least 10 healthy donors. *p < 0.05 and ns not significant, as determined by paired Student’s t-test. (B) IFN-α in supernatants was measured 72 h after PBMCs were stimulated with CpG-A and cultured alone (No AC) and with apoptotic, or necrotic CD4+ T cells. Data are representative of three independent experiments, with error bars indicating SEM. **p < 0.01 and ns not significant, as determined by one-way ANOVA followed by Tukey’s multiple comparison test.

Similar articles

Cited by

References

    1. Casciola-Rosen LA. Autoantigens targeted in systemic lupus erythematosus are clustered in two populations of surface structures on apoptotic keratinocytes. J Exp Med (1994) 179:1317–30.10.1084/jem.179.4.1317 - DOI - PMC - PubMed
    1. Ohlsson M, Jonsson R, Brokstad KA. Subcellular redistribution and surface exposure of the Ro52, Ro60 and La48 autoantigens during apoptosis in human ductal epithelial cells: a possible mechanism in the pathogenesis of Sjogren’s syndrome. Scand J Immunol (2002) 56:456–69.10.1046/j.1365-3083.2002.01072_79.x - DOI - PubMed
    1. Radic M, Marion T, Monestier M. Nucleosomes are exposed at the cell surface in apoptosis. J Immunol (2004) 172:6692–700.10.4049/jimmunol.172.11.6692 - DOI - PubMed
    1. Rosen A, Casciola-Rosen L, Ahearn J. Novel packages of viral and self-antigens are generated during apoptosis. J Exp Med (1995) 181:1557–61.10.1084/jem.181.4.1557 - DOI - PMC - PubMed
    1. Tsokos GC. Systemic lupus erythematosus. N Engl J Med (2011) 365:2110–21.10.1056/NEJMra1100359 - DOI - PubMed

LinkOut - more resources