

Identification and Analysis of NaHCO3 Stress Responsive Genes in Wild Soybean (Glycine soja) Roots by RNA-seq
- PMID: 28018382
- PMCID: PMC5161042
- DOI: 10.3389/fpls.2016.01842
Identification and Analysis of NaHCO3 Stress Responsive Genes in Wild Soybean (Glycine soja) Roots by RNA-seq
Abstract
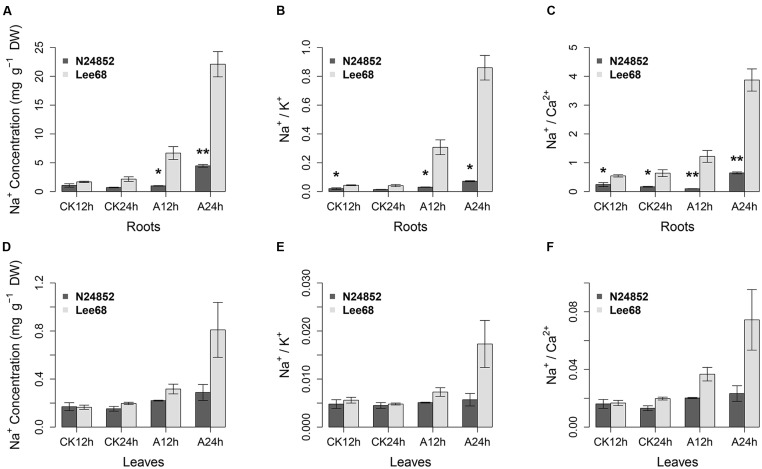
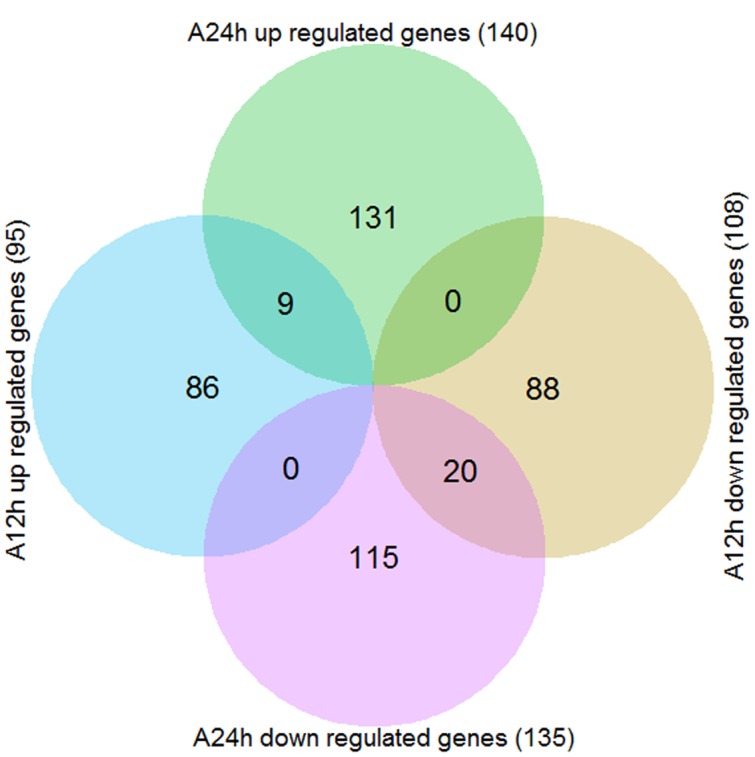
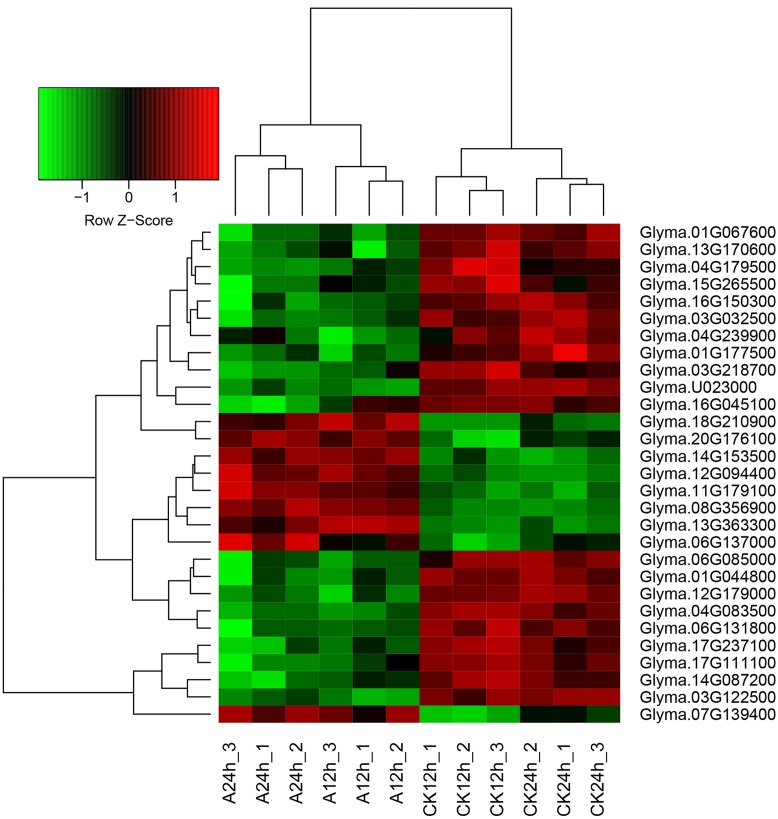
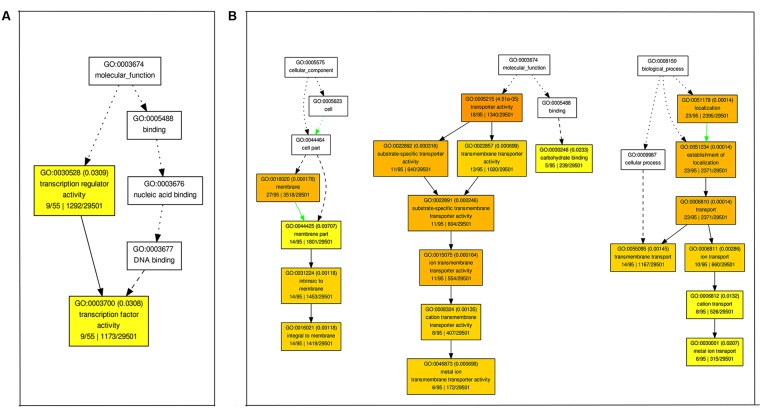
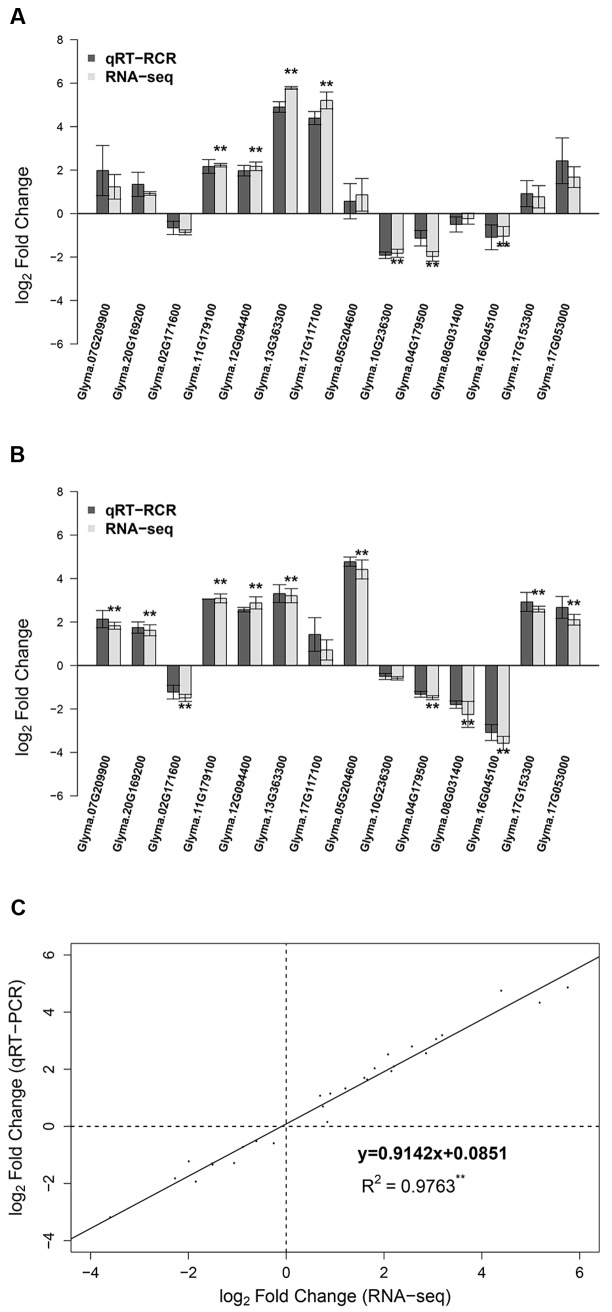
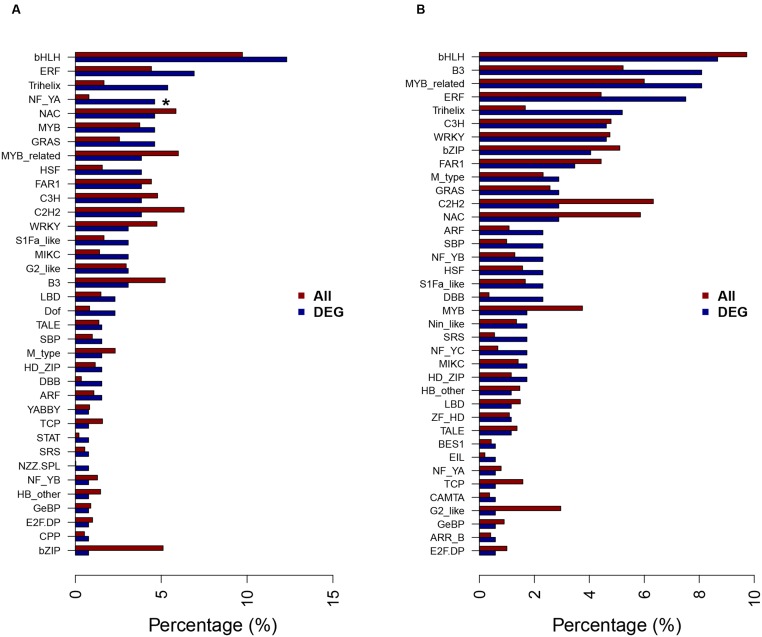
Soil alkalinity is a major abiotic constraint to crop productivity and quality. Wild soybean (Glycine soja) is considered to be more stress-tolerant than cultivated soybean (G. max), and has considerable genetic variation for increasing alkalinity tolerance of soybean. In this study, we analyzed the transcriptome profile in the roots of an alkalinity tolerant wild soybean variety N24852 at 12 and 24 h after 90 mM NaHCO3 stress by RNA-sequencing. Compared with the controls, a total of 449 differentially expressed genes (DEGs) were identified, including 95 and 140 up-regulated genes, and 108 and 135 down-regulated genes at 12 and 24 h after NaHCO3 treatment, respectively. Quantitative RT-PCR analysis of 14 DEGs showed a high consistency with their expression profiles by RNA-sequencing. Gene Ontology (GO) terms related to transcription factors and transporters were significantly enriched in the up-regulated genes at 12 and 24 h after NaHCO3 stress, respectively. Nuclear factor Y subunit A transcription factors were enriched at 12 h after NaHCO3 stress, and high percentages of basic helix-loop-helix, ethylene-responsive factor, Trihelix, and zinc finger (C2H2, C3H) transcription factors were found at both 12 and 24 h after NaHCO3 stress. Genes related to ion transporters such as ABC transporter, aluminum activated malate transporter, glutamate receptor, nitrate transporter/proton dependent oligopeptide family, and S-type anion channel were enriched in up-regulated DEGs at 24 h after NaHCO3 treatment, implying their roles in maintaining ion homeostasis in soybean roots under alkalinity. Kyoto Encyclopedia of Genes and Genomes pathway enrichment analysis showed "phenylpropanoid biosynthesis" and "phenylalanine metabolism" pathways might participate in soybean response to alkalinity. This study provides a foundation to further investigate the functions of NaHCO3 stress-responsive genes and the molecular basis of soybean tolerance to alkalinity.
Keywords: Gene Ontology (GO) enrichment analysis; RNA-seq; alkalinity; differentially expressed gene (DEG); ion transporter; wild soybean.
Figures
Similar articles
-
Wild soybean roots depend on specific transcription factors and oxidation reduction related genesin response to alkaline stress.Funct Integr Genomics. 2015 Nov;15(6):651-60. doi: 10.1007/s10142-015-0439-y. Epub 2015 Apr 15. Funct Integr Genomics. 2015. PMID: 25874911
-
Transcriptome analysis of wild soybean (Glycine soja) under salt stress and identification of salt-responsive genes.Genes Genomics. 2025 Mar;47(3):351-365. doi: 10.1007/s13258-024-01599-3. Epub 2025 Jan 23. Genes Genomics. 2025. PMID: 39849195
-
Global transcriptome profiling of wild soybean (Glycine soja) roots under NaHCO3 treatment.BMC Plant Biol. 2010 Jul 26;10:153. doi: 10.1186/1471-2229-10-153. BMC Plant Biol. 2010. PMID: 20653984 Free PMC article.
-
The Untapped Genetic Reservoir: The Past, Current, and Future Applications of the Wild Soybean (Glycine soja).Front Plant Sci. 2018 Jul 9;9:949. doi: 10.3389/fpls.2018.00949. eCollection 2018. Front Plant Sci. 2018. PMID: 30038633 Free PMC article. Review.
-
Insights into the regulation of wild soybean tolerance to salt-alkaline stress.Front Plant Sci. 2022 Oct 19;13:1002302. doi: 10.3389/fpls.2022.1002302. eCollection 2022. Front Plant Sci. 2022. PMID: 36340388 Free PMC article. Review.
Cited by
-
Transcriptomics Reveals Fast Changes in Salicylate and Jasmonate Signaling Pathways in Shoots of Carbonate-Tolerant Arabidopsis thaliana under Bicarbonate Exposure.Int J Mol Sci. 2021 Jan 27;22(3):1226. doi: 10.3390/ijms22031226. Int J Mol Sci. 2021. PMID: 33513755 Free PMC article.
-
Changes in the Stress Response and Fitness of Hybrids Between Transgenic Soybean and Wild-Type Plants Under Heat Stress.Plants (Basel). 2025 Feb 19;14(4):622. doi: 10.3390/plants14040622. Plants (Basel). 2025. PMID: 40006881 Free PMC article.
-
Genome-Wide Analysis of Glycine soja Response Regulator GsRR Genes Under Alkali and Salt Stresses.Front Plant Sci. 2018 Sep 7;9:1306. doi: 10.3389/fpls.2018.01306. eCollection 2018. Front Plant Sci. 2018. PMID: 30245700 Free PMC article.
-
Connection the Rhizomicrobiome and Plant MAPK Gene Expression Response to Pathogenic Fusarium oxysporum in Wild and Cultivated Soybean.Plant Pathol J. 2019 Dec;35(6):623-634. doi: 10.5423/PPJ.OA.04.2019.0111. Epub 2019 Dec 12. Plant Pathol J. 2019. PMID: 31832042 Free PMC article.
-
Quantitative Phosphoproteomic Analysis Provides Insights into the Sodium Bicarbonate Responsiveness of Glycine max.Biomolecules. 2023 Oct 13;13(10):1520. doi: 10.3390/biom13101520. Biomolecules. 2023. PMID: 37892202 Free PMC article.
References
-
- Abel G. H., Mackenzie A. J. (1964). Salt tolerance of soybean varieties (Glycine max L. Merrill) during germination and later growth. Crop Sci. 4 157–161. 10.2135/cropsci1964.0011183X000400020010x - DOI
LinkOut - more resources
Full Text Sources
Other Literature Sources