

Global Transcriptional Analysis Reveals the Complex Relationship between Tea Quality, Leaf Senescence and the Responses to Cold-Drought Combined Stress in Camellia sinensis
- PMID: 28018394
- PMCID: PMC5145883
- DOI: 10.3389/fpls.2016.01858
Global Transcriptional Analysis Reveals the Complex Relationship between Tea Quality, Leaf Senescence and the Responses to Cold-Drought Combined Stress in Camellia sinensis
Abstract
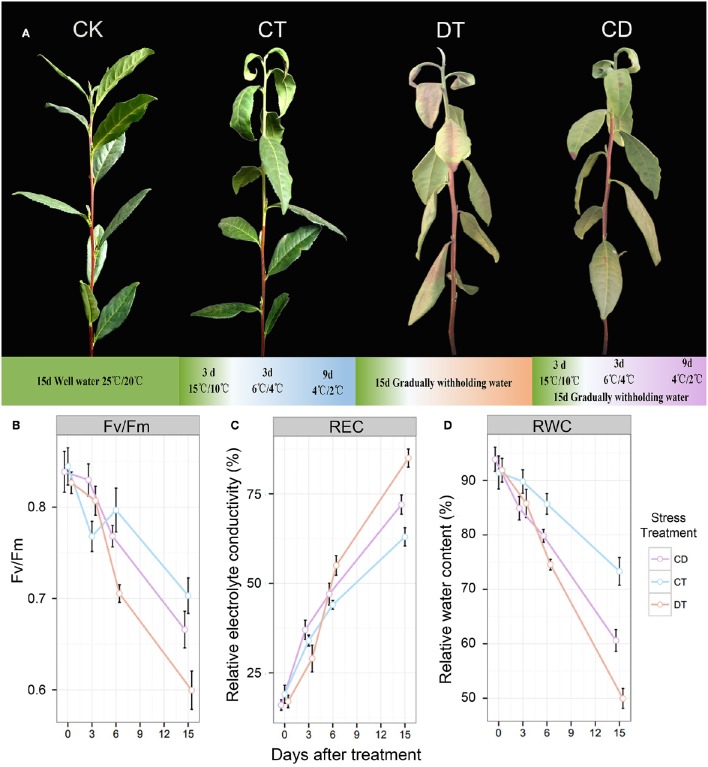
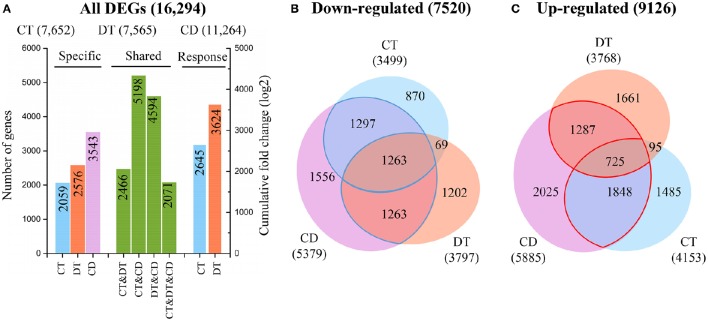
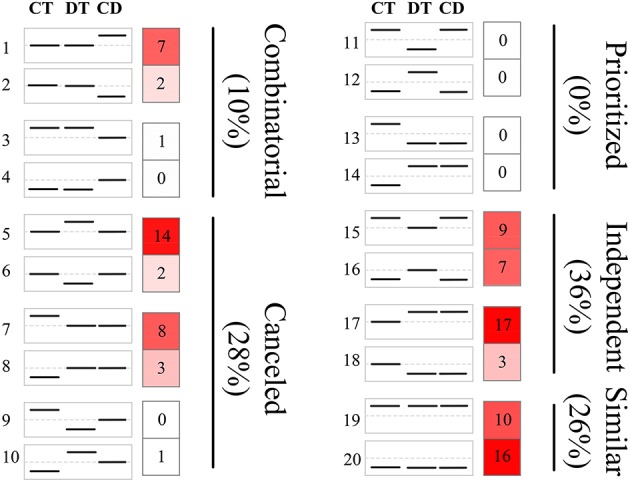
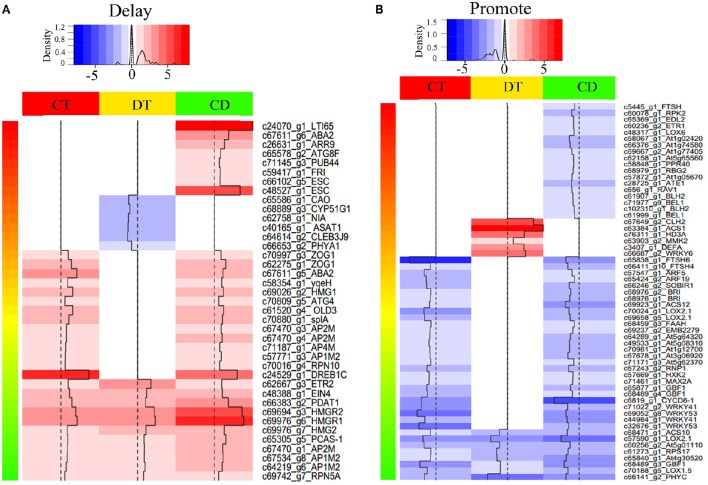
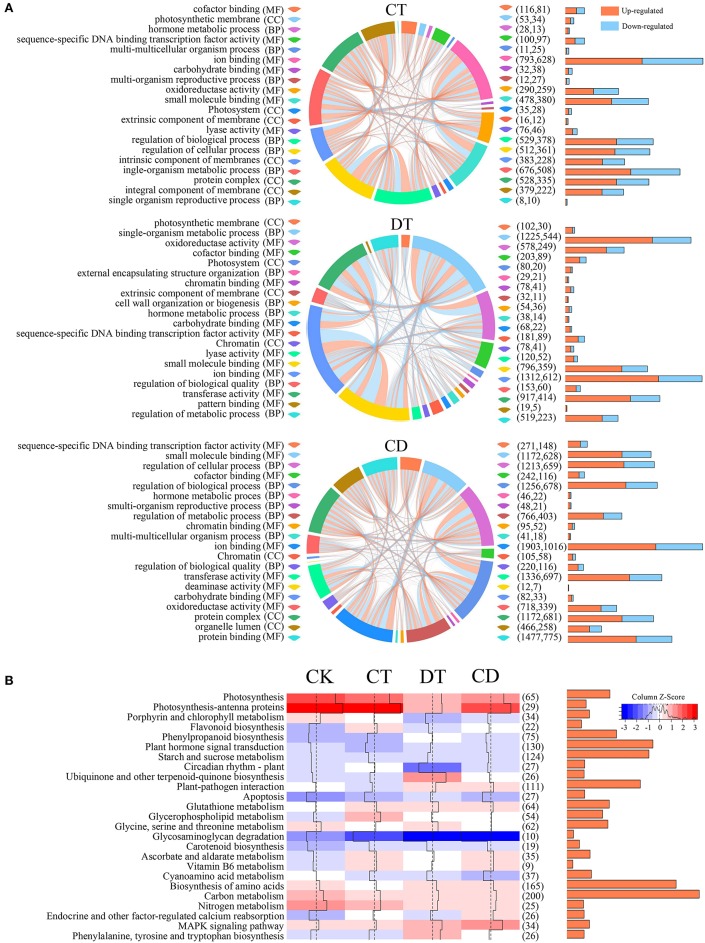
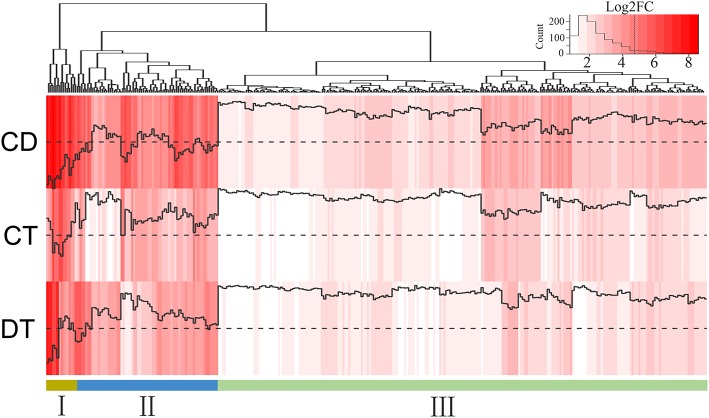
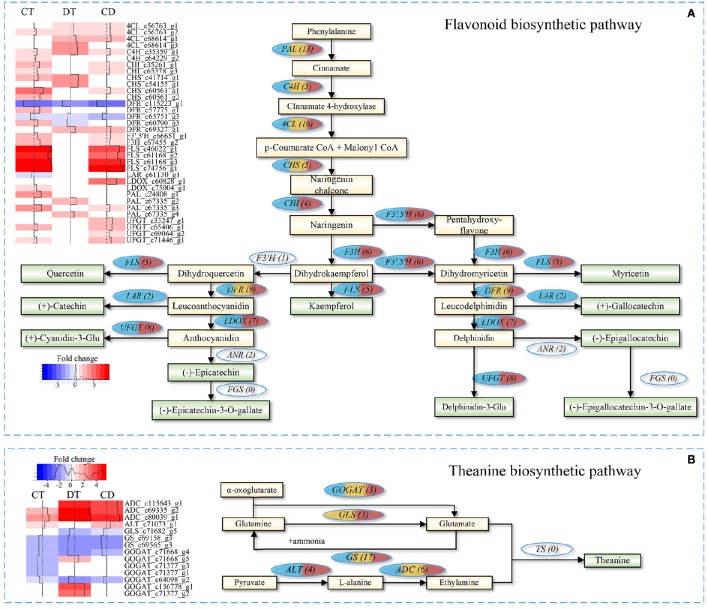
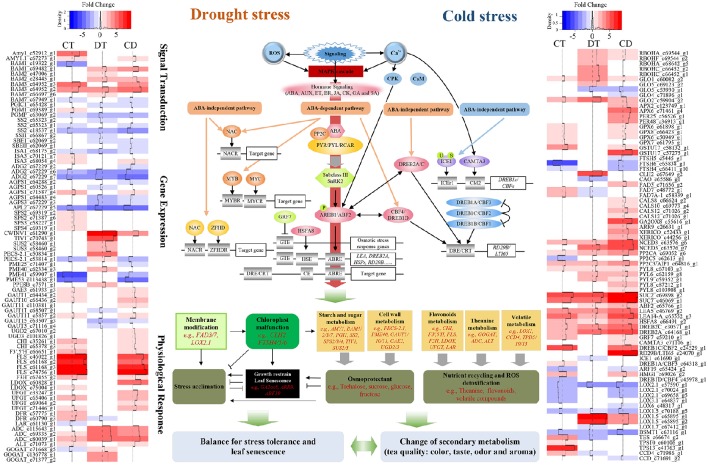
In field conditions, especially in arid and semi-arid areas, tea plants are often simultaneously exposed to various abiotic stresses such as cold and drought, which have profound effects on leaf senescence process and tea quality. However, most studies of gene expression in stress responses focus on a single inciting agent, and the confounding effect of multiple stresses on crop quality and leaf senescence remain unearthed. Here, global transcriptome profiles of tea leaves under separately cold and drought stress were compared with their combination using RNA-Seq technology. This revealed that tea plants shared a large overlap in unigenes displayed "similar" (26%) expression pattern and avoid antagonistic responses (lowest level of "prioritized" mode: 0%) to exhibit very congruent responses to co-occurring cold and drought stress; 31.5% differential expressed genes and 38% of the transcriptome changes in response to combined stresses were unpredictable from cold or drought single-case studies. We also identified 319 candidate genes for enhancing plant resistance to combined stress. We then investigated the combined effect of cold and drought on tea quality and leaf senescence. Our results showed that drought-induced leaf senescence were severely delayed by (i) modulation of a number of senescence-associated genes and cold responsive genes, (ii) enhancement of antioxidant capacity, (iii) attenuation of lipid degradation, (iv) maintenance of cell wall and photosynthetic system, (v) alteration of senescence-induced sugar effect/sensitivity, as well as (vi) regulation of secondary metabolism pathways that significantly influence the quality of tea during combined stress. Therefore, care should be taken when utilizing a set of stresses to try and maximize leaf longevity and tea quality.
Keywords: Camellia sinensis; RNA-Seq; cold-drought combined stress; leaf senescence; tea quality.
Figures
Similar articles
-
Haplotype-Resolution Transcriptome Analysis Reveals Important Responsive Gene Modules and Allele-Specific Expression Contributions under Continuous Salt and Drought in Camellia sinensis.Genes (Basel). 2023 Jul 8;14(7):1417. doi: 10.3390/genes14071417. Genes (Basel). 2023. PMID: 37510320 Free PMC article.
-
Comparative Expression Analysis of Stress-Inducible Candidate Genes in Response to Cold and Drought in Tea Plant [Camellia sinensis (L.) Kuntze].Front Genet. 2020 Dec 23;11:611283. doi: 10.3389/fgene.2020.611283. eCollection 2020. Front Genet. 2020. PMID: 33424935 Free PMC article.
-
Long-term cold, freezing and drought: overlapping and specific regulatory mechanisms and signal transduction in tea plant (Camellia sinensis (L.) Kuntze).Front Plant Sci. 2023 May 10;14:1145793. doi: 10.3389/fpls.2023.1145793. eCollection 2023. Front Plant Sci. 2023. PMID: 37235017 Free PMC article.
-
Advances in the knowledge of adaptive mechanisms mediating abiotic stress responses in Camellia sinensis.Front Biosci (Landmark Ed). 2021 Dec 30;26(12):1714-1722. doi: 10.52586/5063. Front Biosci (Landmark Ed). 2021. PMID: 34994184 Review.
-
Proteomics and phosphoproteomics reveal the different drought-responsive mechanisms of priming with (Z)-3-hexenyl acetate in two tea cultivars.J Proteomics. 2023 Oct 30;289:105010. doi: 10.1016/j.jprot.2023.105010. Epub 2023 Oct 4. J Proteomics. 2023. PMID: 37797878 Review.
Cited by
-
Understanding the Origin and Evolution of Tea (Camellia sinensis [L.]): Genomic Advances in Tea.J Mol Evol. 2023 Apr;91(2):156-168. doi: 10.1007/s00239-023-10099-z. Epub 2023 Mar 1. J Mol Evol. 2023. PMID: 36859501 Review.
-
Identification and Expression Analyses of SBP-Box Genes Reveal Their Involvement in Abiotic Stress and Hormone Response in Tea Plant (Camellia sinensis).Int J Mol Sci. 2018 Oct 30;19(11):3404. doi: 10.3390/ijms19113404. Int J Mol Sci. 2018. PMID: 30380795 Free PMC article.
-
Alternative splicing in tea plants was extensively triggered by drought, heat and their combined stresses.PeerJ. 2020 Jan 29;8:e8258. doi: 10.7717/peerj.8258. eCollection 2020. PeerJ. 2020. PMID: 32030318 Free PMC article.
-
Electrochemical Sensors and Biosensors for the Analysis of Tea Components: A Bibliometric Review.Front Chem. 2022 Jan 14;9:818461. doi: 10.3389/fchem.2021.818461. eCollection 2021. Front Chem. 2022. PMID: 35096777 Free PMC article. Review.
-
Stress cross-response of the antioxidative system promoted by superimposed drought and cold conditions in Coffea spp.PLoS One. 2018 Jun 5;13(6):e0198694. doi: 10.1371/journal.pone.0198694. eCollection 2018. PLoS One. 2018. PMID: 29870563 Free PMC article.
References
LinkOut - more resources
Full Text Sources
Other Literature Sources