

Evolution in eggs and phases: experimental evolution of fecundity and reproductive timing in Caenorhabditis elegans
- PMID: 28018635
- PMCID: PMC5180133
- DOI: 10.1098/rsos.160496
Evolution in eggs and phases: experimental evolution of fecundity and reproductive timing in Caenorhabditis elegans
Abstract
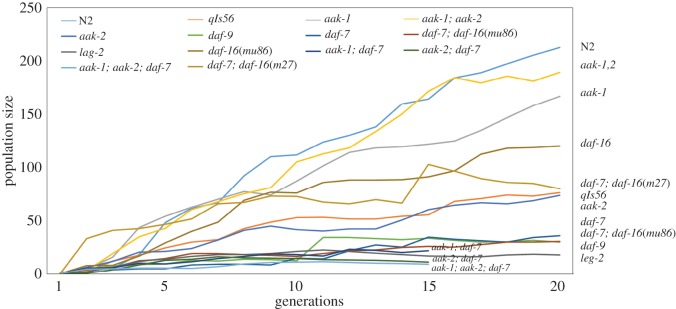
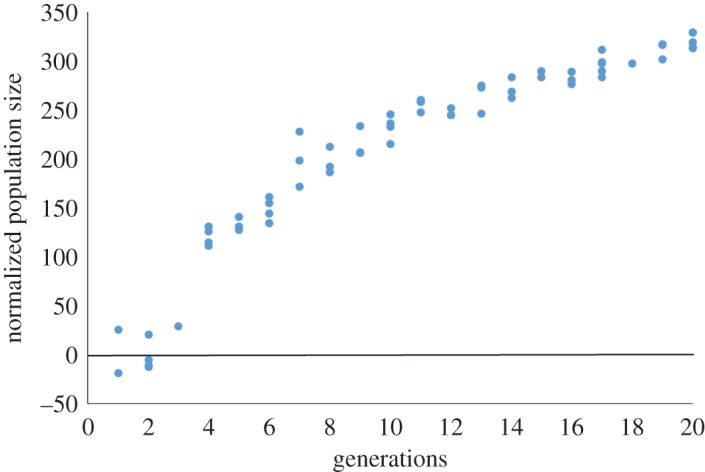
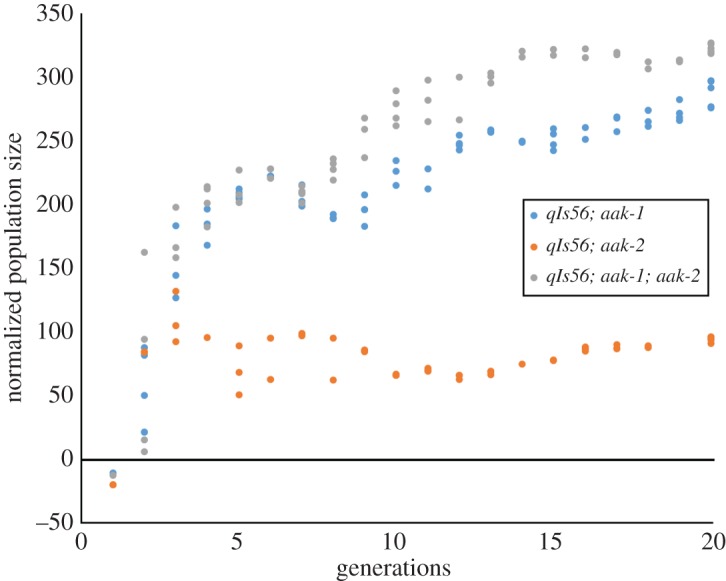
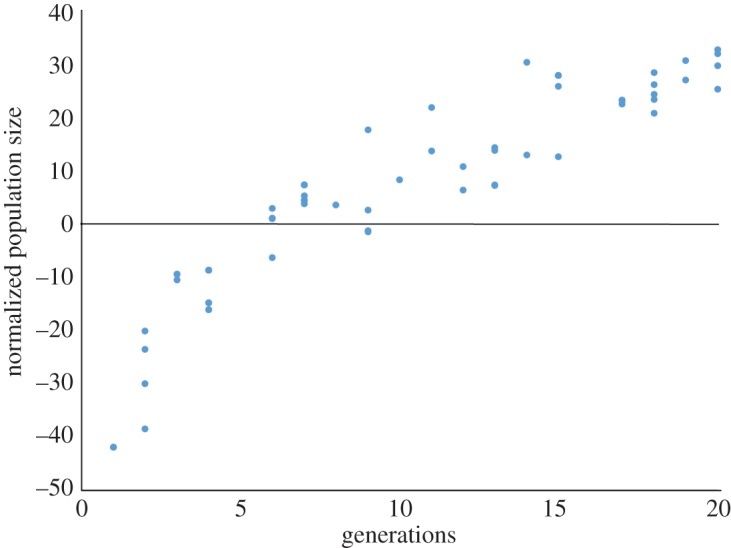
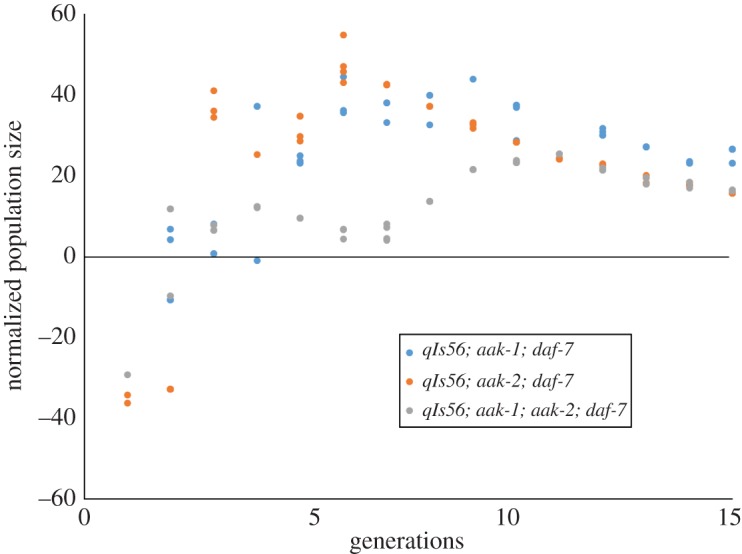
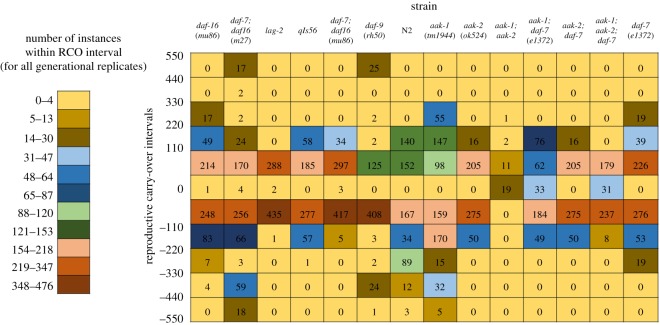
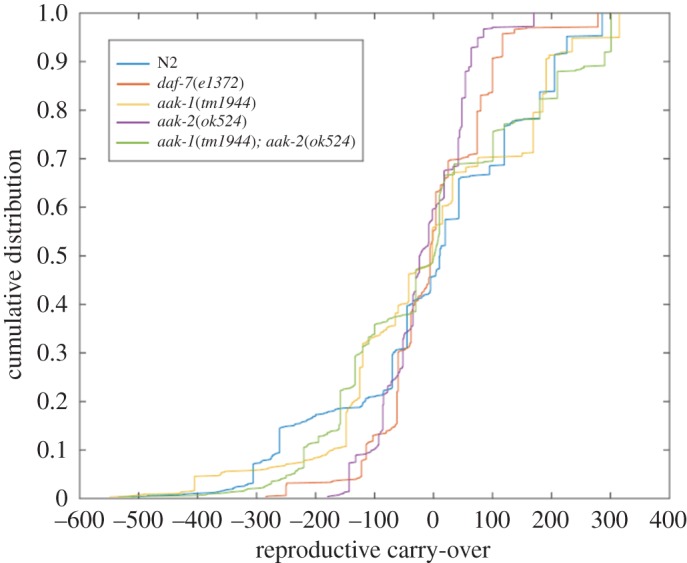
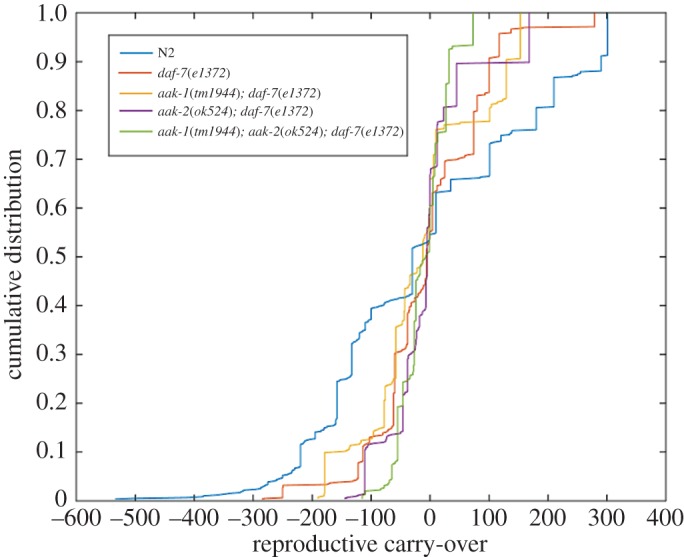
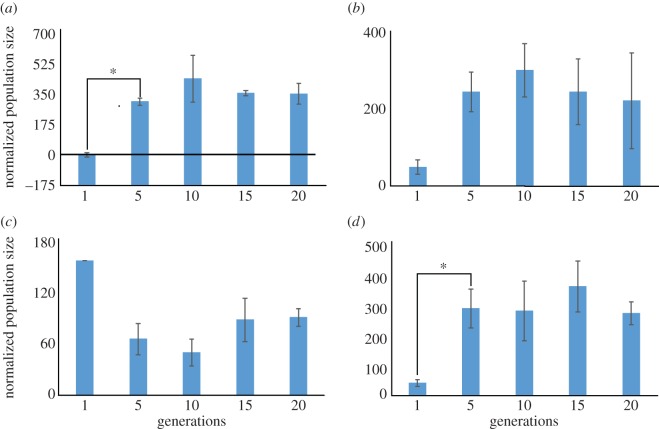
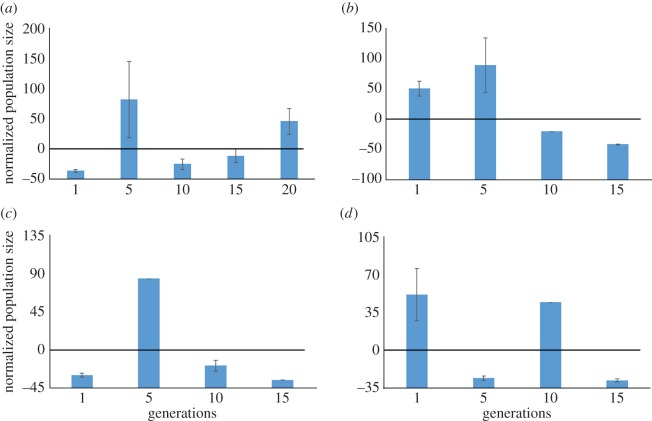
To examine the role of natural selection in fecundity in a variety of Caenorhabditis elegans genetic backgrounds, we used an experimental evolution protocol to evolve 14 distinct genetic strains over 15-20 generations. We were able to generate 790 distinct genealogies, which provided information on both the effects of natural selection and the evolvability of each strain. Among these genotypes are a wild-type (N2) and a collection of mutants with targeted mutations in the daf-c, daf-d and AMPK pathways. Differences are observed in reproductive fitness along with related changes in reproductive timing. The majority of selective effects on fecundity occur during the first few generations of evolution, while the negative selection for reproductive timing occurs on longer time scales. In addition, positive selection on fecundity results in positive and negative strain-dependent selection on reproductive timing. A derivative of population size per generation called reproductive carry-over (RCO) may be informative in terms of developmental selection. While these findings transcend mutations in a specific gene, changes in the RCO measure may nevertheless be products of selection. In conclusion, the broader implications of these findings are discussed, particularly in the context of genotype-fitness maps and the role of uncharacterized mutations in individual variation and evolvability.
Keywords: evolution of development; experimental evolution; reproductive dynamics.
Figures
References
-
- Fay DS. 2016. Classical genetic methods. In WormBook: the online review of C. elegans biology. Pasadena, CA: WormBook.
-
- Kawecki TJ, Lenski RE, Ebert D, Hollis B, Olivieri I, Whitlock MC. 2012. Experimental evolution. Trends Ecol. Evol. 27, 547–560. (doi:10.1016/j.tree.2012.06.001) - DOI - PubMed
-
- Bataillon T, Joyce P, Sniegowski P. 2012. As it happens: current directions in experimental evolution. Biol. Lett. 9, 20120945 (doi:10.1098/rsbl.2012.0945) - DOI - PMC - PubMed
-
- Gray JC, Cutter AD. 2014. Mainstreaming Caenorhabditis elegans in experimental evolution. Proc. R. Soc. B 281, 20133055 (doi:10.1098/rspb.2013.3055) - DOI - PMC - PubMed
-
- Ward S, Carrel JS. 1979. Fertilization and sperm competition in the nematode Caenorhabditis elegans. Dev. Biol. 73, 304–321. (doi:10.1016/0012-1606(79)90069-1) - DOI - PubMed
Grants and funding
LinkOut - more resources
Full Text Sources
Other Literature Sources
Research Materials
Miscellaneous