. 2016 Dec 15:3:78.
doi: 10.3389/fmolb.2016.00078. eCollection 2016.

The Mutational Landscape of the Oncogenic MZF1 SCAN Domain in Cancer

Affiliations

The Mutational Landscape of the Oncogenic MZF1 SCAN Domain in Cancer

Mads Nygaard et al. Front Mol Biosci. .

Abstract

SCAN domains in zinc-finger transcription factors are crucial mediators of protein-protein interactions. Up to 240 SCAN-domain encoding genes have been identified throughout the human genome. These include cancer-related genes, such as the myeloid zinc finger 1 (MZF1), an oncogenic transcription factor involved in the progression of many solid cancers. The mechanisms by which SCAN homo- and heterodimers assemble and how they alter the transcriptional activity of zinc-finger transcription factors in cancer and other diseases remain to be investigated. Here, we provide the first description of the conformational ensemble of the MZF1 SCAN domain cross-validated against NMR experimental data, which are probes of structure and dynamics on different timescales. We investigated the protein-protein interaction network of MZF1 and how it is perturbed in different cancer types by the analyses of high-throughput proteomics and RNASeq data. Collectively, we integrated many computational approaches, ranging from simple empirical energy functions to all-atom microsecond molecular dynamics simulations and network analyses to unravel the effects of cancer-related substitutions in relation to MZF1 structure and interactions.

Keywords: FoldX; RNAseq; TCGA; cancer mutations; molecular dynamics; protein structure network; saturation mutagenesis; transcription factors.


Figures

Figure 1
Figure 1
(A) The direct network of MZF1 protein-protein interactions. Interaction partners of MZF1 were extracted from the Interologous Interaction Database (I2D). (B) Results of gene ontology (GO) enrichment analysis. Similarity of GO-terms was estimated using the R-package GOSemSim (Yu et al., 2010). The shade and size of dot indicates relevance (strength) of similarity. The diagonal is similarity with self. Similarity scores range from 0 to 1.0.
Figure 2
Figure 2
Predicted protein-protein interactions mediated by MZF1 SCAN domains. The predicted homo- and hetero-dimeric complexes of MZF1 SCAN domain (PDB entry 2FI2 chain A orange, chain B blue) and ZNF174 SCAN domain (PDB entry 1Y7Q chain A green) ZNF24 SCAN domain (PDB entry 3LHR chain A cyan) and Cdk4 (PDB entry 3G33 chain A violet) are represented as cartoon and surface in (A–D), respectively. We calculated the residues of the two proteins in each complex that have at least one atom within 0.4 nm of distance from the binding partner and we highlighted their Ca as spheres. These residues are shown in bold in the amino acid sequences of the SCAN domains. (A) Predicted homo-dimer of MZF1 SCAN domain with indicated in green the position of the deleterious mutations that we identified. The amino acid sequence of MZF1 SCAN domain is reported. (B) Predicted hetero-dimer of MZF1 SCAN domain and Cdk4 (blue and violet, respectively). (C) Predicted hetero-dimer of MZF1 and ZNF24 SCAN domains (orange and cyan, respectively) (D) Predicted hetero-dimer of MZF1 and ZNF174 SCAN domains (blue and green, respectively). The amino acid sequence of the MZF1/ZNF24 and MZF1/ZNF174 SCAN domain complexes are reported and the residues at the interaction interfaces are shown in bold. (E) PRISM docking energies for the dimeric complexes between MZF1 and MZF1 partners from the I2D database and with Peg3 and Zfp206 SCAN domains. PRISM predicts with similar energies three different SCAN template interfaces (2fi2AB, 3lhrAB, and 1y7qAB) for nearly all the predicted homo- and hetero-complexes involving SCAN domains, as for example in the case of the homodimer of Znf174 where the three interfaces have docking energy values ranging from −47 to −45 kcal/mol. In the table we reported the predicted interaction complexes with lowest energies for each pair of interactors.
Figure 3
Figure 3
(Upper panel) Comparison of MZF1 expression levels as determined by RNASeq experiments comparing paired tumor and normal samples of patients from different cancer studies deposited in TCGA. (Lower panel) Correlation between changes in the expression levels of MZF1 and its interactors as determined by RNASeq experiments comparing paired tumor and normal samples. In each network, the absolute value of the difference between the medians of the counts per gene in the normal samples and tumor samples was used to represent the node colors, upon log2 transformation. The color shade of the edges represented the value of the Pearson correlation coefficient calculated for each MZF1 interactor-pair according to the counts presented in the tumor samples with respect to the normal samples. Red and blue dotted lines show positively and negatively correlated pairs, respectively.
Figure 4
Figure 4
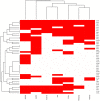
Heat-map and clustering of the effects induced by MZF1 mutations on protein function as predicted by sequence-based classifiers. Seven sequence-based methods have been employed for the prediction, i.e., Align-GVGD (AGVGD), SNAP2, PON-P2, Polyphen2 (PP2), Mutation Assessor, PROVEAN, MutPred. Deleterious and neutral mutations are depicted in red and white, respectively. A complete consensus is observed only for a small fraction of the mutations. Nevertheless, the different methods are in reasonable agreement, with most of the mutations showing consensus for five out of seven methods.
Figure 5
Figure 5
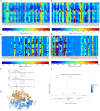
Effects on thermodynamic protein stability and protein-protein complexes upon in silico saturation mutagenesis of MZF1 SCAN domain. (A–D) Heatmap based on calculations of ΔΔG associated with monomer protein stability (A,B) and monomer-monomer binding (C,D). (E) The distribution of the ΔΔG values from saturation mutagenesis of the monomer or dimer MZF1 SCAN domain is shown. (F) ΔΔG predictions for mutations in MZF1 SCAN domain that have been deposited in cancer databases and other databases of genetic variations. (G) Structural constraints induced by P58 rigid side chain promote a cluster of electrostatic interactions at the dimerization interface.
Figure 6
Figure 6
Differences between predicted chemical shifts from MD simulations and experimentally measured chemical shifts along the simulation time. All the simulations are largely in agreement with experimentally derived chemical shifts. Indeed, the MD ensemble converge to very low deviation from the experiments after 200–300 ns of simulation. The chemical shift for different backbone atom types are shown in the panels (A–D).
Figure 7
Figure 7
Density plot of the average distance difference of NOE pairs between MD simulations and measured NOEs. For all the panels, the distances were averaged over the trajectory and subtracted from the measured NOE (see Section Materials and Methods). The distance differences between the all measured NOEs (A) are very similar for all of the force fields (black; NMR conformers, blue; Amber-ff99SB-NMR-ILDN, green; Amber-ff99SB*-ILDN, red; CHARMM22*, cyan; CHARMM27, magenta; RSFF1) as well as for the 20 NMR conformers (PDB:2fi2). Noticeable is a slightly lower average distance between the NOE pairs compared to the experimentally obtained values. The similarity between the force fields is observed when plotting only long range NOEs (B), short range NOEs, (C) as well as the intermolecular NOEs (D).
Figure 8
Figure 8
Prediction of Resolution values for the different MD ensemble of MZF1 dimer generated using different atomistic force fields. A χ2-like score was used to estimate the differences between experimental and computationally derived chemical shifts as detailed in the Section Materials and Methods.
Figure 9
Figure 9
Hub localization on MZF1 dimeric structure upon PSN analyses of the MD simulations. Since in a PSN a hub is defined as a residue connected by at least three edges, all the residues with a degree lower than three are set at zero. The structure is depicted as ribbon with rainbow shades of colors from blue to red according to the node degree. The MZF1 residues for which mutations have been collected from different databases reported in Table S2 are depicted as spheres centered on their Cα atoms. The results for all the MD simulations (A), Amber99-SB-NMR-ILDN (B), Amber99-SB*-ILDN (C), CHARMM22* (D), CHARMM27 (E), and RSFF1 (F) simulations are shown in the different panels.
Figure 10
Figure 10
The shortest paths of communications between C69 and P58 (A), E41 (B), E54 (C), and R124 (D) are shown.The initial and terminal residues of each path are highlighted as spheres. Chain A and B are colored in orange and blue, respectively. The intermediate nodes in each path are shown as sticks and the residues on the protein surface discussed in the text are shown as dots. The blue, red, and gray colors refer to the different atom types (i.e., N, O, and C, respectively). The paths are the following: C69A-> V88A->R66B->L62B->A116A->Q59B->P58B (sum of weights 254.2, average weight 42.4); C69A->F47A->Q91B->R48A->E90A->R44A->E41A (sum of weights 411.6, average weight 68.6); 69CB->88VA->66RB->62LB->A116A->P58B->D120A->R123A->E54A (sum of weights 372.7, average weight 46.6); and C69B ->V88A->R66B->L62B->A116A->P58B->D120A->R124A (sum of weights 336.1, average weight 48).

Similar articles

Cited by

References

    1. Adzhubei I., Jordan D. M., Sunyaev S. R. (2013). Predicting functional effect of human missense mutations using PolyPhen-2. Curr. Protoc. Hum. Genet. 76:7.20, 7.20.1–7.20.41. 10.1002/0471142905.hg0720s76 - DOI - PMC - PubMed
    1. Ahmed J., Meinel T., Dunkel M., Murgueitio M. S., Adams R., Blasse C., et al. . (2011). CancerResource: a comprehensive database of cancer-relevant proteins and compound interactions supported by experimental knowledge. Nucleic Acids Res. 39, 1–8. 10.1093/nar/gkq910 - DOI - PMC - PubMed
    1. Auton A., Abecasis G. R., Altshuler D. M., Durbin R. M., Bentley D. R., Chakravarti A., et al. . (2015). A global reference for human genetic variation. Nature 526, 68–74. 10.1038/nature15393 - DOI - PMC - PubMed
    1. Baspinar A., Cukuroglu E., Nussinov R., Keskin O., Gursoy A. (2014). PRISM: a web server and repository for prediction of protein-protein interactions and modeling their 3D complexes. Nucleic Acids Res. 42, W285–W289. 10.1093/nar/gku397 - DOI - PMC - PubMed
    1. Beauchamp K. A., Lin Y.-S., Das R., Pande V. S. (2012). Are Protein force fields getting better? a systematic benchmark on 524 diverse NMR measurements. J. Chem. Theory Comput. 8, 1409–1414. 10.1021/ct2007814 - DOI - PMC - PubMed

LinkOut - more resources