. 2016 Oct;3(4):045008.
doi: 10.1117/1.NPh.3.4.045008. Epub 2016 Dec 19.

Prefrontal hemodynamic mapping by functional near-infrared spectroscopy in response to thermal stimulations over three body sites

Affiliations

Prefrontal hemodynamic mapping by functional near-infrared spectroscopy in response to thermal stimulations over three body sites

Amarnath Yennu et al. Neurophotonics. 2016 Oct.

Abstract

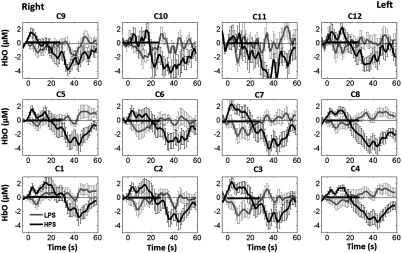
Functional near-infrared spectroscopy (fNIRS) was used to examine hemodynamic responses in the prefrontal cortex (PFC) during noxious thermal pain, induced by thermal stimulations over three different body sites over the right forearm, right temporomandibular joint, and left forearm. Functional NIRS measurements were obtained from three groups of healthy volunteers, one group for each body region. Each group was subjected to both low-pain stimulation (LPS) and high-pain stimulation (HPS) by a [Formula: see text] thermode of a temperature-controlled thermal stimulator over the respective three body sites. Our results showed that HPS given at three sites induced significant increases ([Formula: see text]) in oxy-hemoglobin concentration ([Formula: see text]) in the PFC with similar temporal patterns in relatively spread PFC areas. In contrast, LPS did not cause any significant [Formula: see text] in the PFC of any subject group. Our observed PFC activations induced by acute HPS were generally consistent with previous reports by fMRI studies. The study also found a peculiar global trend of postpain deactivation in the PFC, which is attributed to global vasoconstriction due to acute nocuous pain. Overall, these results indicate that hemodynamic activities in PFC exhibit consistent temporal and spatial patterns in response to acute thermal stimulation given across all three body sites.

Keywords: functional near-infrared spectroscopy; innocuous pain; noxious pain; prefrontal hemodynamic mapping; thermal stimulations.


Figures

Fig. 1
Fig. 1
(a) Experimental paradigm used in this study for thermal stimulation. (b) Selection of 12 clusters for data analysis. Red circles are light sources, and blue circles are light detectors. Solid black arrows at the left bottom (n=6) show the six channels (source–detector pairs) grouped as one cluster. The word “Right” marks each subject’s right side. (c) Optical optode array placed on a subject’s head with the geometry shown in Fig. 1(b). (d) Coregistration of the light sources and detectors on a standard human brain template. (e) Placement of the thermode over the right forearm region. Yellow arrow points to the thermode position over right forearm. The stimulation site was about 5 cm away from the right elbow. (f) Placement of the thermode over the right side of each subject’s TMJ region.
Fig. 2
Fig. 2
Group average of temporal profiles of ΔHbO concentration (in microMolar) across 16 subjects under the right forearm thermal stimulation, for all clusters (labeled as C1,C2,,C12). Gray and black curves represent group-averaged temporal profiles of ΔHbO in response to LPS and HPS, respectively. Error bars are standard errors. Solid black lines on x-axis represent the stimulation period.
Fig. 3
Fig. 3
Group average of temporal profiles of ΔHbO concentration (in microMolar) across nine subjects under right TMJ thermal stimulation, for all clusters (labeled as C1,C2,,C12). Gray and black curves represent group-averaged temporal profiles of ΔHbO in response to LPS and HPS, respectively. Error bars are standard errors. Solid black lines on x-axis represent the stimulation period.
Fig. 4
Fig. 4
Group average of temporal profiles of ΔHbO concentration (in microMolar) across nine subjects under left forearm thermal stimulation, for all clusters (labeled as C1,C2,,C12). Gray and black curves represent group-averaged temporal profiles of ΔHbO in response to LPS and HPS, respectively. Error bars are standard errors. Solid black lines on x-axis represent the stimulation period.
Fig. 5
Fig. 5
(a)–(c) Group-averaged norms of residuals averaged across respective subjects when the recovery predictor duration was varied (between 1 and 30 s with an increment of 1 s) to fit ΔHbO in response to LPS over the right forearm, right TMJ, and left forearm, respectively. (d)–(f) Group-averaged norms of residuals averaged across respective subjects when the recovery predictor duration was varied to fit ΔHbO in response to HPS over the right forearm, right TMJ, and left forearm, respectively.
Fig. 6
Fig. 6
(a)–(c) Topographic images of group-averaged prefrontal cortical activations and/or deactivations (i.e., β-maps derived from ΔHbO) during LPS, HPS, and post-HPS recovery periods, respectively, with thermal stimulation given on the right forearm. (d)–(f) Topographic images of group-averaged prefrontal cortical activations and/or deactivations (β-maps) during LPS, HPS, and post-HPS periods, respectively, with thermal stimulation on the right TMJ region. (g)–(i) Topographic images of group-averaged frontal cortical activations and/or deactivations (β-maps) during LPS, HPS, and post-HPS periods, respectively, with thermal stimulation over the left forearm.
Fig. 7
Fig. 7
(a)–(c) Topographic images of statistical t-maps (p<0.05, FDR corrected) for LPS versus baseline, HPS versus baseline, and post-HPS recovery versus baseline, respectively, with thermal stimulation given on the right forearm. (d)–(f) Topographic images of t-maps (p<0.05, FDR corrected) for LPS versus baseline, HPS versus baseline, and post-HPS recovery versus baseline, respectively, with thermal stimulation over the right TMJ area. (g)–(i) Topographic images of t-maps (p<0.05, FDR corrected) for LPS versus baseline, HPS versus baseline, and post-HPS recovery versus baseline, respectively, with thermal stimulation over the left forearm.
Fig. 8
Fig. 8
Group-averaged temporal profiles of ΔHb (in microMolar) across 16 subjects under the right forearm thermal stimulation, for all clusters (labeled as C1,C2,,C12). Gray and black curves represent group-averaged profiles of ΔHb in response to LPS and HPS, respectively. Error bars are standard errors. Solid black lines mark the stimulation period.
Fig. 9
Fig. 9
Group-averaged temporal profiles of ΔHb concentration (in microMolar) across nine subjects under right TMJ thermal stimulation, for all clusters (labeled as C1,C2,,C12). Gray and black curves represent ΔHb profiles in response to LPS and HPS, respectively. Error bars are standard errors. Solid black lines represent the stimulation period.
Fig. 10
Fig. 10
Group-averaged temporal profiles of ΔHb (in microMolar) across nine subjects under left forearm thermal stimulation, for all clusters (labeled as C1,C2,,C12). Gray and black curves represent temporal profiles in response to LPS and HPS, respectively. Error bars are standard errors. Solid black lines represent the stimulation period.
Fig. 11
Fig. 11
Topographic images of group-averaged prefrontal cortical activations and/or deactivations (i.e., β-maps derived from ΔHb) during LPS and HPS, respectively, with thermal stimulation given on the (a) and (b) right forearm, (c) and (d) the right TMJ region, and (e) and (f) the left forearm.

Similar articles

Cited by

References

    1. Casey K. L., “Forebrain mechanisms of nociception and pain: analysis through imaging,” Proc. Natl. Acad. Sci. U.S.A. 96, 7668–7674 (1999).10.1073/pnas.96.14.7668 - DOI - PMC - PubMed
    1. Peyron R., Laurent B., Garcia-Larrea L., “Functional imaging of brain responses to pain. A review and meta-analysis (2000),” Neurophysiol. Clin. 30, 263–288 (2000).NCLIE410.1016/S0987-7053(00)00227-6 - DOI - PubMed
    1. Mackey S. C., Maeda F., “Functional imaging and the neural systems of chronic pain,” Neurosurg. Clin. N. Am. 15, 269–288 (2004).10.1016/j.nec.2004.03.001 - DOI - PubMed
    1. Neugebauer V., et al. , “Forebrain pain mechanisms,” Brain Res. Rev. 60, 226–242 (2009).BRERD210.1016/j.brainresrev.2008.12.014 - DOI - PMC - PubMed
    1. Seminowicz D. A., Mikulis D. J., Davis K. D., “Cognitive modulation of pain-related brain responses depends on behavioral strategy,” Pain 112, 48–58 (2004).PAINDB10.1016/j.pain.2004.07.027 - DOI - PubMed