. 2016 Oct;3(4):044506.
doi: 10.1117/1.JMI.3.4.044506. Epub 2016 Dec 19.

LUNGx Challenge for computerized lung nodule classification

Affiliations

LUNGx Challenge for computerized lung nodule classification

Samuel G Armato 3rd et al. J Med Imaging (Bellingham). 2016 Oct.

Abstract

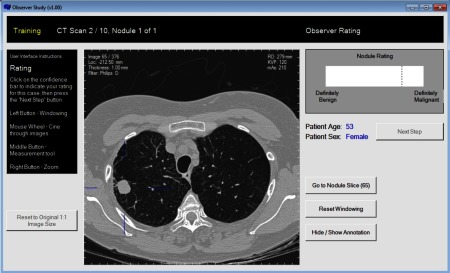
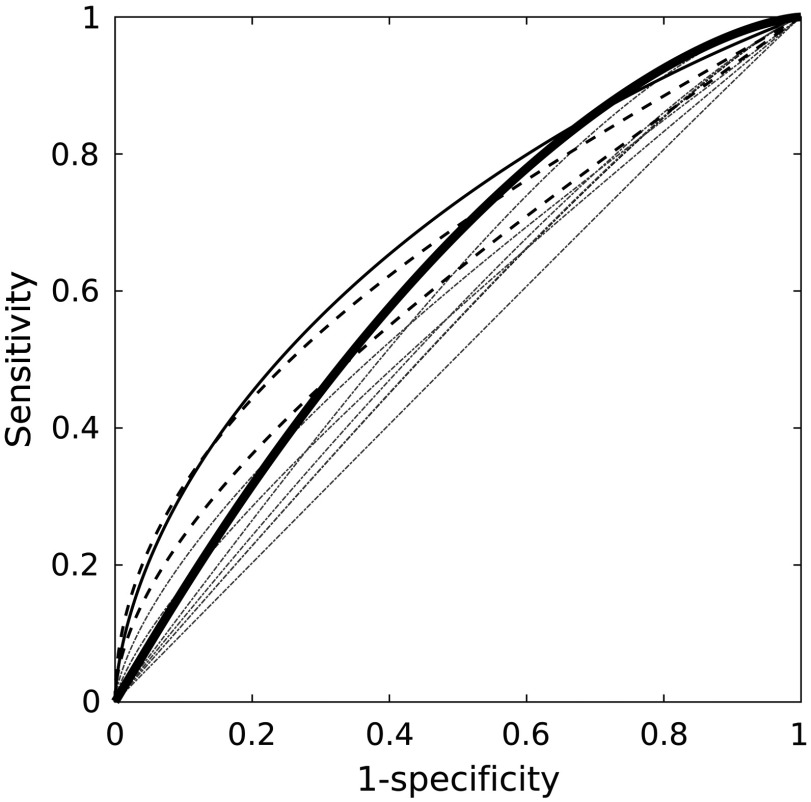
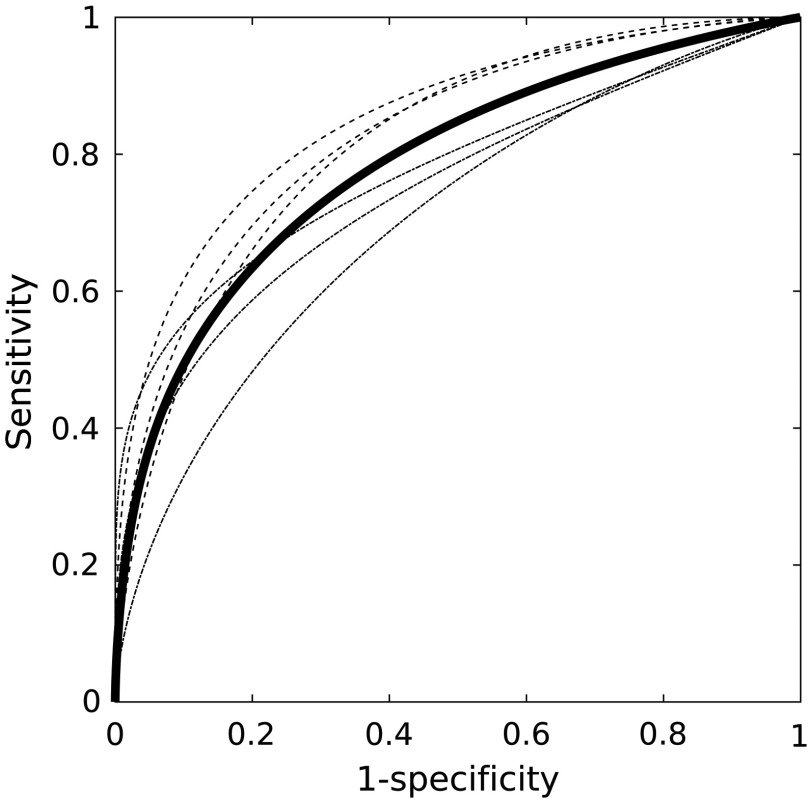
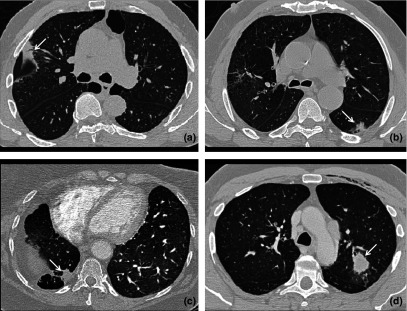
The purpose of this work is to describe the LUNGx Challenge for the computerized classification of lung nodules on diagnostic computed tomography (CT) scans as benign or malignant and report the performance of participants' computerized methods along with that of six radiologists who participated in an observer study performing the same Challenge task on the same dataset. The Challenge provided sets of calibration and testing scans, established a performance assessment process, and created an infrastructure for case dissemination and result submission. Ten groups applied their own methods to 73 lung nodules (37 benign and 36 malignant) that were selected to achieve approximate size matching between the two cohorts. Area under the receiver operating characteristic curve (AUC) values for these methods ranged from 0.50 to 0.68; only three methods performed statistically better than random guessing. The radiologists' AUC values ranged from 0.70 to 0.85; three radiologists performed statistically better than the best-performing computer method. The LUNGx Challenge compared the performance of computerized methods in the task of differentiating benign from malignant lung nodules on CT scans, placed in the context of the performance of radiologists on the same task. The continued public availability of the Challenge cases will provide a valuable resource for the medical imaging research community.

Keywords: challenge; classification; computed tomography; computer-aided diagnosis; image analysis; lung nodule.


Figures

Fig. 1
Fig. 1
The interface developed for the observer study allowed a user to raster through all section images of a scan, manipulate the visualization settings, and view relevant patient and image-acquisition information from the image DICOM headers. Nodules for evaluation were demarcated with blue crosshairs. Radiologists used the slider bar to mark their assessment of nodule malignancy.
Fig. 2
Fig. 2
ROC curves for the 11 participating classification methods, with AUC values ranging from 0.50 to 0.68. The thick solid curve is for radiologist-determined nodule size alone (AUC=0.62). The two dashed curves outperformed random guessing but failed to be statistically different from nodule size. The thin solid curve is for the winning algorithm, which outperformed random guessing and was noninferior to nodule size alone.
Fig. 3
Fig. 3
ROC curves for the six radiologists from the observer study. The thick solid curve is for the radiologists as a group. The dashed curves represent those radiologists who significantly outperformed the CAD winner. The AUC values ranged from 0.70 to 0.85, with a mean AUC value across all six radiologists of 0.79.
Fig. 4
Fig. 4
(a) A benign nodule (arrow) for which the best-performing method returned (correctly) a low likelihood of malignancy score but to which all radiologists assigned higher malignancy ratings. (b) A malignant nodule (arrow) for which the best-performing method returned (correctly) a high likelihood of malignancy score but to which all radiologists assigned lower malignancy ratings. (c) A benign nodule (arrow) that was misdiagnosed by the best-performing method but that received a low malignancy rating from the best-performing radiologist. (d) A malignant nodule (arrow) that was misdiagnosed by the best-performing method but that received a high malignancy rating from the best-performing radiologist.

References

    1. Nishikawa R. M., et al. , “Effect of case selection on the performance of computer-aided detection schemes,” Med. Phys. 21, 265–269 (1994). 10.1118/1.597287 - DOI - PubMed
    1. Nishikawa R. M., et al. , “Variations in measured performance of CAD schemes due to database composition and scoring protocol,” Proc. SPIE 3338, 840–844 (1998). 10.1117/12.310894 - DOI
    1. Revesz G., Kundel H. L., Bonitatibus M., “The effect of verification on the assessment of imaging techniques,” Invest. Radiol. 18, 194–198 (1983). 10.1097/00004424-198303000-00018 - DOI - PubMed
    1. van Ginneken B., “Why Challenges?” http://grand-challenge.org/Why_Challenges/ (December 2015).
    1. Murphy K., “Development and evaluation of automated image analysis techniques in thoracic CT,” PhD Thesis, Utrecht University (2011).