. 2017 Jan;6(1):58-66.
doi: 10.1002/psp4.12143. Epub 2016 Dec 26.

Model-Based Population Pharmacokinetic Analysis of Nivolumab in Patients With Solid Tumors

Affiliations

Model-Based Population Pharmacokinetic Analysis of Nivolumab in Patients With Solid Tumors

G Bajaj et al. CPT Pharmacometrics Syst Pharmacol. 2017 Jan.

Abstract

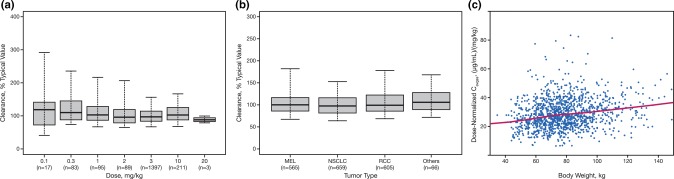
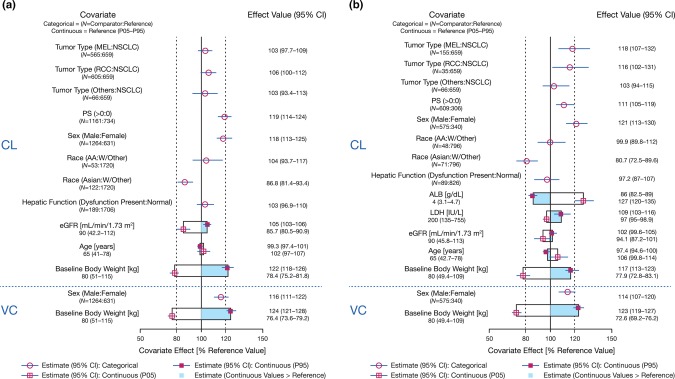
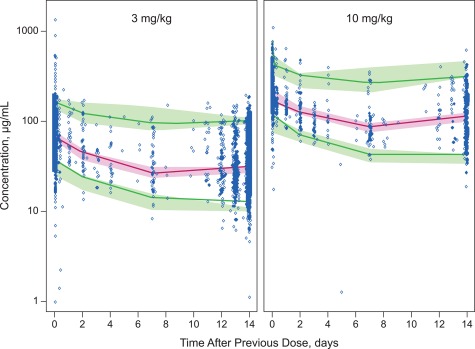
Nivolumab is a fully human monoclonal antibody that inhibits programmed death-1 activation. The clinical pharmacology profile of nivolumab was analyzed by a population pharmacokinetics model that assessed covariate effects on nivolumab concentrations in 1,895 patients who received 0.3-10.0 mg/kg nivolumab in 11 clinical trials. Nivolumab pharmacokinetics is linear with a time-varying clearance. A full covariate model was developed to assess covariate effects on pharmacokinetic parameters. Nivolumab clearance and volume of distribution increase with body weight. The final model included the effects of baseline performance status (PS), baseline body weight, and baseline estimated glomerular filtration rate (eGFR), sex, and race on clearance, and effects of baseline body weight and sex on volume of distribution in the central compartment. Sex, PS, baseline eGFR, age, race, baseline lactate dehydrogenase, mild hepatic impairment, tumor type, tumor burden, and programmed death ligand-1 expression had a significant but not clinically relevant (<20%) effect on nivolumab clearance.


Figures

Figure 1
Figure 1
(a) PPK‐based estimates of individual nivolumab clearance vs. dose based on final PPK model. The boxplots represent median (bold line), 25th, and 75th percentiles of clearance distribution. The whiskers represent 5th and 95th percentiles of the distribution. PPK, population pharmacokinetic. (b) Distribution of nivolumab clearance estimates across tumor types using final PPK model. The boxplots represent median (bold line), 25th, and 75th percentiles of the distribution. The whiskers represent 5th and 95th percentiles of the distribution. (c) Nivolumab dose‐normalized Cavgss vs. body weight for body weight‐based, Q2W dose regimens. Normalized exposure is Cavgss. Solid line represents locally weighted smooth line and is used to visualize relationships between dose‐normalized Cavgss and body weight. Cavgss, average concentration at steady state; CRC, colorectal cancer; CRPC, castration‐resistant prostate cancer; MEL, melanoma; NSCLC, non‐small cell lung cancer; PPK, population pharmacokinetic; Q2W, every 2 weeks; RCC, renal cell carcinoma.
Figure 2
Figure 2
(a,b) Covariate effects on PK model parameters from full population PK model. Categorical covariate effects (95% CI) are represented by open symbols (horizontal lines). Continuous covariate effects (95% CI) at the 5th/95th percentiles of the covariate are represented by the end of horizontal boxes (horizontal lines). Open/shaded area of boxes represents the range of covariate effects from the median to the 5th/95th percentile of the covariate. The reference patient is a 65‐year‐old Caucasian/other female weighing 80 kg with a baseline performance status of 0, LDH of 200 IU/L, baseline ALB of 4 g/dL, estimated GFR of 90 mL/min/1.73 m2, and normal hepatic function. Parameter estimate in reference patient is considered 100% (vertical solid line), and dashed vertical lines are at 80% and 120% of this value. AA, African American; ALB, albumin; CI, confidence interval; CL, clearance; eGFR, estimated glomerular filtration rate; LDH, lactate dehydrogenase; MEL, melanoma; NSCLC, non‐small cell lung cancer; PS, baseline performance status; RCC, renal cell carcinoma; PK, pharmacokinetics; VC, volume of central compartment; W, white.
Figure 3
Figure 3
Model validation representative visual predictive check from final population pharmacokinetic model: nivolumab concentration vs. actual time after dose. Representative visual predictive check of concentration (log scale) vs. actual time after previous dose for 3.0 mg/kg and 10.0 mg/kg Q2W doses. Dots are observed data and the solid lines represent the 5th, 50th, and 95th percentiles of observed data, respectively. The shaded areas represent the simulation‐based 90% confidence intervals for the 5th, 50th, and 95th percentiles of the predicted data. Q2W, every 2 weeks.

References

    1. Sharpe, A.H. , Wherry, E.J. , Ahmed, R. & Freeman, G.J. The function of programmed cell death 1 and its ligands in regulating autoimmunity and infection. Nat Immunol. 8, 239–245 (2007). - PubMed
    1. Momtaz, P. & Postow, M.A. Immunologic checkpoints in cancer therapy: focus on the programmed death‐1 (PD‐1) receptor pathway. Pharmgenomics Pers Med. 7, 357–365 (2014). - PMC - PubMed
    1. Ott, P.A. , Hodi, F.S. & Robert, C. CTLA‐4 and PD‐1/PD‐L1 blockade: new immunotherapeutic modalities with durable clinical benefit in melanoma patients. Clin Cancer Res. 19, 5300–5309 (2013). - PubMed
    1. Jurado, J.O. et al Programmed death (PD)−1:PD‐ligand 1/PD‐ligand 2 pathway inhibits T cell effector functions during human tuberculosis. J Immunol. 181, 116–125 (2008). - PubMed
    1. Wang, C. et al In vitro characterization of the anti‐PD‐1 antibody nivolumab, BMS‐936558, and in vivo toxicology in non‐human primates. Cancer Immunol Res. 2, 846–856 (2014). - PubMed

MeSH terms