. 2017 Feb;23(2):235-241.
doi: 10.1038/nm.4256. Epub 2016 Dec 26.

Direct evidence for cancer-cell-autonomous extracellular protein catabolism in pancreatic tumors

Affiliations

Direct evidence for cancer-cell-autonomous extracellular protein catabolism in pancreatic tumors

Shawn M Davidson et al. Nat Med. 2017 Feb.

Abstract

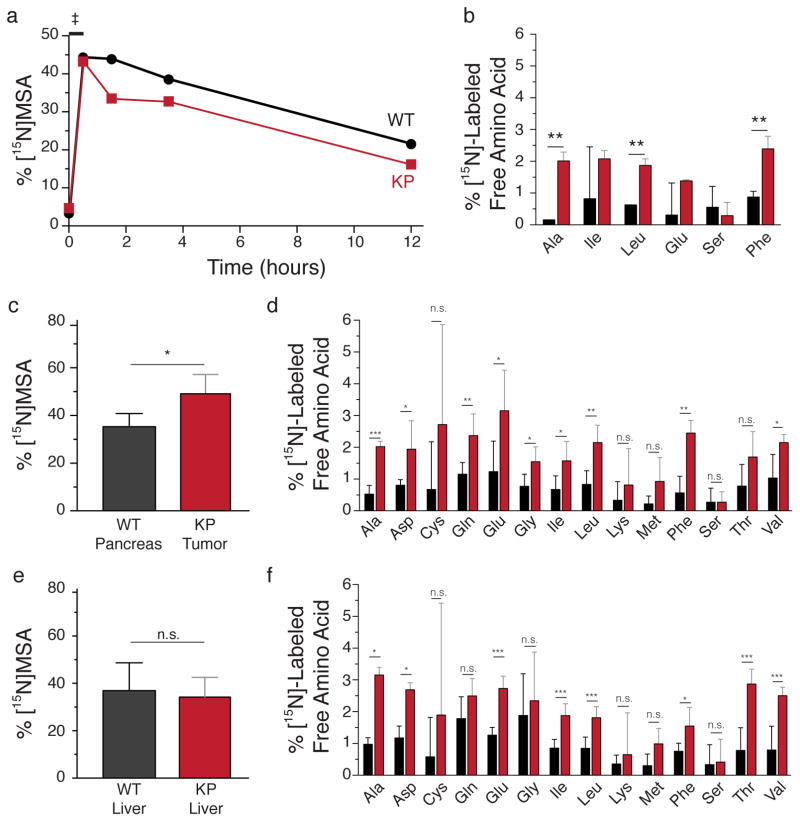
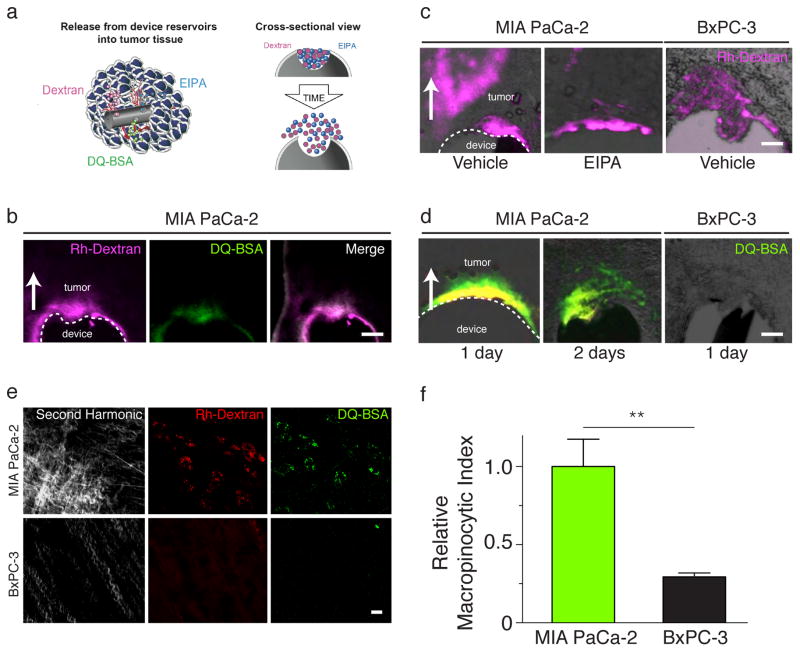
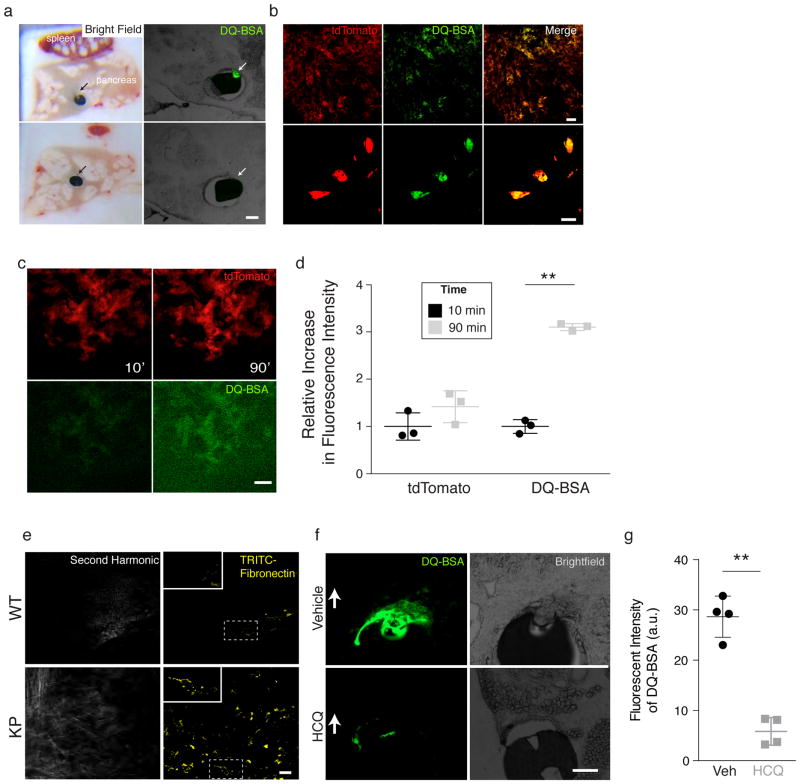
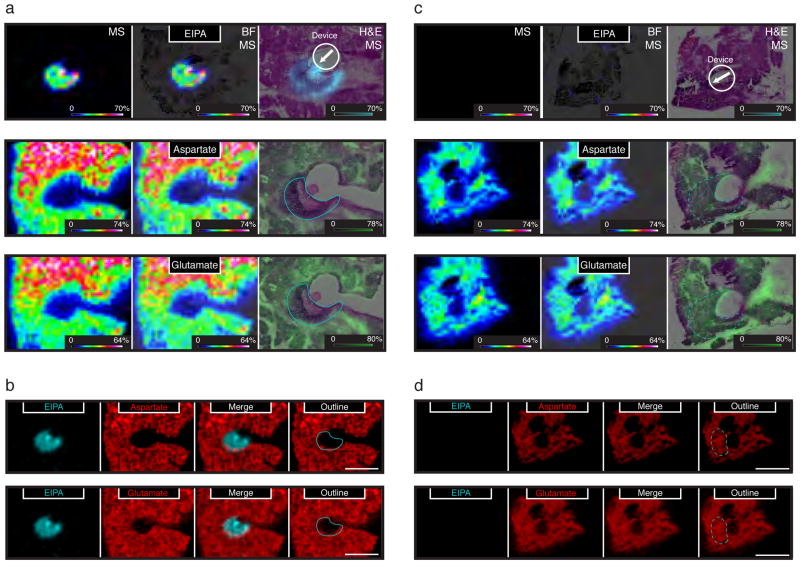
Mammalian tissues rely on a variety of nutrients to support their physiological functions. It is known that altered metabolism is involved in the pathogenesis of cancer, but which nutrients support the inappropriate growth of intact malignant tumors is incompletely understood. Amino acids are essential nutrients for many cancer cells that can be obtained through the scavenging and catabolism of extracellular protein via macropinocytosis. In particular, macropinocytosis can be a nutrient source for pancreatic cancer cells, but it is not fully understood how the tumor environment influences metabolic phenotypes and whether macropinocytosis supports the maintenance of amino acid levels within pancreatic tumors. Here we utilize miniaturized plasma exchange to deliver labeled albumin to tissues in live mice, and we demonstrate that breakdown of albumin contributes to the supply of free amino acids in pancreatic tumors. We also deliver albumin directly into tumors using an implantable microdevice, which was adapted and modified from ref. 9. Following implantation, we directly observe protein catabolism and macropinocytosis in situ by pancreatic cancer cells, but not by adjacent, non-cancerous pancreatic tissue. In addition, we find that intratumoral inhibition of macropinocytosis decreases amino acid levels. Taken together, these data suggest that pancreatic cancer cells consume extracellular protein, including albumin, and that this consumption serves as an important source of amino acids for pancreatic cancer cells in vivo.


Figures

Figure 1
Figure 1. Albumin-derived amino acids are found in pancreatic tumors
a. Representative albumin enrichment in the plasma of WT and KP mice following plasma exchange of [15N]-labeled mouse serum albumin ([15N]MSA) for endogenous albumin as assessed by analysis of labeled albumin peptides. The %[15N]MSA shown was obtained by analysis of the albumin peptide LVQEVTDFAK in plasma by LC-MS/MS over time during and after plasma exchange (n = 5 per genotype). The time indicated by the double dagger corresponds to the 30-minute period of plasma exchange. b. Labeled amino acids in the plasma of WT and KP mice following plasma exchange of [15N]-labeled MSA for endogenous MSA. Plasma was sampled at the time of tissue collection (~12 hours post-exchange). The presence of [15N]-labeled amino acids was determined by GC-MS, (n = 5 per genotype). c. Following plasma exchange of [15N]-labeled MSA for endogenous MSA in WT and KP mice, the presence of [15N]MSA in tissue was determined by analysis of multiple labeled peptides from normal pancreas (WT) or pancreatic tumors (KP) by LC-MS/MS, (n = 5 per genotype). d. The presence of labeled amino acids in the pancreas (WT) or tumor (KP) from WT and KP mice respectively following plasma exchange of [15N]-labeled MSA for endogenous MSA. Tissues were collected ~12 hours post-exchange and labeled amino acids determined by GC-MS (n = 5 per genotype). e. Following plasma exchange of [15N]-labeled MSA for endogenous MSA in WT and KP mice, the presence of [15N]MSA in tissue was determined by analysis of multiple labeled peptides from livers of animals with pancreatic tumors (KP) or without pancreatic tumors (WT) by LC-MS/MS, (n = 5 per genotype). f. The presence of labeled amino acids in the livers of WT or KP mice ~12 hours following plasma exchange of [15N]-labeled albumin for endogenous albumin. Labeled amino acids were determined by GC-MS. For all panels, (Ala = alanine; Asp = aspartate; Cys = cysteine; Gln = glutamine; Glu = glutamate; Gly = glycine; Ile = isoleucine; Leu = leucine; Lys = lysine; Met = methionine; Phe = phenylalanine; Ser = serine; Thr = threonine; Val = valine), significance differences are noted as P * < 0.05; ** < 0.01; ***<0.001; n.s. difference not significant, by unpaired t-test.
Figure 2
Figure 2. Direct assessment of macropinocytosis and albumin catabolism in tumors
a. Schematic depicting device implanted directly into the tumor to release specified contents from reservoirs into distinct tissue regions. Radially outward diffusion of compounds from reservoirs is shown in 3-dimensional (left) and cross-sectional views (right). The orientation of the schematic on the right matches the orientation of device placement relative to tissue in panels b, c, and d. b. Combined delivery of 70 kDa rhodamine-dextran (Rh-Dextran) and self-quenched, BODIPY-labeled bovine serine albumin (DQ-BSA). Both compounds are released from a single reservoir in MIA PaCa-2 tumors. Radial transport of compound is ~150 μm from the device into tissue after a 24h incubation period. Scale bar, 200 μm. (images are representative of n = 6 from mice per cell line per condition with triplicate reservoirs). c. Delivery of 70 kDa Rh-Dextran from the device into MIA PaCa-2 and BxPC-3 tumor tissue at 48h. Unlike MIA PaCa-2 tumors, BxPC-3 tumors have been shown previously not to engage in macropinocytosis. Tissue penetration up to ~550 μm is observed in each tumor. Co-delivery of 70kDa Rh-Dextran with the macropinocytosis inhibitor EIPA leads to reduced Rh-Dextran uptake in MIA PaCa-2 tumor tissue as shown. Scale bar, 150 μm. (images are representative of n = 6 from two mice per cell line per condition with triplicate reservoirs). d. Comparison of albumin breakdown in MIA PaCa-2 and BxPC-3 tumor sections. Devices containing DQ-BSA were implanted into MIA PaCa-2 and BxPC-3 tumors as indicated. Degradation of BSA, indicated by fluorescence signal from DQ-BSA, increases over time in MIA PaCa-2 tumors a depth of 200μm from the device after 1 day, and up to 350μm from the device after 2 days. Scale bar, 200 μm. (images are representative of n = 6 from two mice per cell line per condition with triplicate reservoirs). e. Examination of albumin and dextran uptake in MIA PaCa-2 and BxPC-3 tumors. Multiphoton images of live tumors implanted with devices containing 70kDa Rh-Dextran and DQ-BSA. Fluorescence from DQ-BSA is observed in individual cells in MIA PaCa-2 tumors by 4h after device implantation, and high concordance is observed between cells that display Rh-Dextran uptake and DQ-BSA fluorescence. Scale bar, 20 μm. (images are representative of n = 2 mice per cell line per condition with duplicate reservoirs). f. Quantification of relative macropinocytic index in MIA PaCa-2 and BxPC-3 xenograft tumors based on DQ-BSA fluorescence. Macropinocytic index is a ratio of the total area of all macropinosomes in a field of designated area (n=5 distinct fields per cell line). For all panels, white arrows indicate direction of delivery of DQ-BSA, Rh-Dextran, or EIPA. (data from n = 2 mice per cell line per condition with duplicate reservoirs used to calculate macropinocytic index). Significance values indicated as P ** < 0.01, by unpaired t-test.
Figure 3
Figure 3. Albumin catabolism and fibronectin internalization in autochthonous KrasG12D-driven pancreatic tumors catabolize albumin and internalize fibronectin
a. Differential albumin breakdown in tumor compared to normal pancreatic tissue. Devices containing self-quenched, BODIPY-labeled bovine serine albumin (DQ-BSA) were implanted directly into the pancreas of KP mice with pancreatic tumors. Tissue sections visualized by bright-field (left) and fluorescence (right) microscopy are shown. Arrows indicate reservoir position that corresponds to the site of DQ-BSA delivery. DQ-BSA fluorescence is observed only in areas where the device contacts tumor tissue (top), and not when the device is adjacent to non-malignant pancreatic tissue (bottom). (images are representative of n = 2 mice per cell line per condition with triplicate reservoirs). b. Cellular fate of albumin catabolism. Multiphoton microscopy images of pancreatic tumors in live KP mice that also harbor a tdTomatoLSL allele (KPT) to mark cancer cells with red fluorescence. Images were obtained 4h post device implantation to deliver DQ-BSA. Green fluorescence corresponding to catabolism of DQ-BSA localizes with tumor cells marked by red fluorescence. Low (top) and high power (bottom) images are shown. Scale bar, 20 μm for both low and high power images. (images are representative of n = 4 mice per cell line per condition with duplicate reservoirs). c. Multiphoton images of pancreatic tumors in live KPT mice showing increasing fluorescence from DQ-BSA over time. Red fluorescence marking tumor cells (top) and green fluorescence from DQ-BSA (bottom) are shown at 10- and 90-minutes post device implantation. Scale bar, 50 μm. (images are representative of n = 2 mice per genotype per condition with duplicate reservoirs). d. Quantification of DQ-BSA fluorescence from the experiment in (C) reveals greater than 3-fold increase in fluorescence from 10- to 90-minutes. tdTomato fluorescence is also shown and changes minimally over the same 90-minute period. (n = 2 mice per genotype per condition with duplicate reservoirs). e. Multiphoton images of normal pancreas (WT) and pancreatic tumors (KP) in live mice. Second harmonic generation is used to detect fibrillar collagen and displayed to demonstrate background auto-fluorescence in the TRITC channel. Images were obtained 30min post device implantation to deliver TRITC-Fibronectin (yellow). Cellularity of internalized TRITC-fibronectin was visualized and observed only in KP mice. White dashed outline indicates area of magnification to demonstrate cellular distribution of TRITC-fibronectin. Scale bar, 20μM. (Images are representative of n = 2 mice per genotype per condition with duplicate reservoirs). f. Devices containing self-quenched, BODIPY-labeled bovine serine albumin (DQ-BSA) with vehicle or the lysosomal inhibitor hydroxychloroquine (HCQ) were implanted directly into the pancreas of KP mice with pancreatic tumors. Tissue sections visualized by bright-field (left) and fluorescence (right) microscopy are shown. White arrows indicate reservoir position that corresponds to the site of DQ-BSA delivery. A strong decrease in DQ-BSA is observed in the presence of HCQ (images are representative of n = 5 distinct regions of tumor per condition). g. Quantification of fluorescent intensity of DQ-BSA in the presence and absence of HCQ (n = 5 distinct regions of tumor per condition). Significance values indicated as P ** < 0.01, by unpaired t-test.
Figure 4
Figure 4. Local depletion of amino acids following inhibition of macropinocytosis in KrasG12D-driven pancreatic tumors in vivo
a. Devices containing EIPA were implanted directly into pancreatic tumors of KP mice. 24 hours after device implantation, serial sections from the tumor were analyzed by matrix assisted laser desorption ionization coupled to imaging mass-spectrometry (MALDI-IMS). Positive ion mode was used to detect the macropinocytosis inhibitor, EIPA (top panels; EIPA diffused approximately 400–500μM). Negative ion mode used to detect the amino acids aspartate and glutamate (middle and bottom panels respectively). A scale bar representing the intensity range of ions detected for each image is included in the lower right of each panel and the length of this bar corresponds to 1mm. The left panels (MS) show the mass spectrometry signal only, the center panels (BF, MS) show an overlay of the mass spectrometry signal with a bright field image of an adjacent tissue section, and the right panels (H&E, MS) show an overlay of the mass spectrometry signal and an H&E stain of an adjacent tissue section. Schematic demonstrating device placement is included in the upper right as a white circle with an arrow indicating direction of EIPA release. A blue line indicates the extent of the EIPA signal in the H&E, MS images. Images are representative of n = 2 KP mice with triplicate reservoirs. b. Qualitative signal for EIPA (blue) and signal from the amino acids aspartate (top) and glutamate (bottom) (red) are shown as separate and overlaid images as indicated. Also shown is an outline (blue line) of the extent of EIPA signal overlaid on the aspartate and glutamate signal as indicated. White scale bar corresponds to 1mm. c. Devices containing vehicle control (polyethylene glycol) were implanted directly into pancreatic tumors of KP mice. 24 hours after device implantation, serial sections from the tumor were analyzed by matrix-assisted laser desorption ionization coupled to imaging mass-spectrometry (MALDI-IMS). Positive ion mode was used to demonstrate the absence of the macropinocytosis inhibitor, EIPA (top panels; No EIPA observed, vehicle). Negative ion mode used to detect the amino acids aspartate and glutamate (middle and bottom panels respectively). A scale bar representing the intensity range of ions detected for each image is included in the lower right of each panel and the length of this bar corresponds to 1mm. The left panels (MS) show the mass spectrometry signal only, the center panels (BF, MS) show an overlay of the mass spectrometry signal with a bright field image of an adjacent tissue section, and the right panels (H&E, MS) show an overlay of the mass spectrometry signal and an H&E stain of an adjacent tissue section. Schematic demonstrating device placement is included in the upper right as a white circle with an arrow indicating direction of vehicle release. A blue dashed line indicates the approximate extent of diffusion based on diffusion of EIPA in A. Images are representative of n = 2 KP mice with triplicate reservoirs. d. Qualitative signal for EIPA (blue) and signal from the amino acids aspartate (top) and glutamate (bottom) (red) are shown as separate and overlaid images as indicated. Also shown is an outline (blue dashed line) of the expected extent of EIPA diffusion if it were included in the reservoir. White scale bar corresponds to 1mm.

Comment in

Similar articles

Cited by

References

    1. Metallo CM, Vander Heiden MG. Understanding metabolic regulation and its influence on cell physiology. Mol Cell. 2013;49:388–398. - PMC - PubMed
    1. Mayers JR, Vander Heiden MG. Famine versus feast: understanding the metabolism of tumors in vivo. Trends Biochem Sci. 2015;40:130–140. - PMC - PubMed
    1. White E. Exploiting the bad eating habits of Ras-driven cancers. Genes & Development. 2013;27:2065–2071. - PMC - PubMed
    1. Vander Heiden MG, Cantley LC, Thompson CB. Understanding the Warburg effect: the metabolic requirements of cell proliferation. Science. 2009;324:1029–1033. - PMC - PubMed
    1. Locasale JW. Serine, glycine and one-carbon units: cancer metabolism in full circle. Nat Rev Cancer. 2013;13:572–583. - PMC - PubMed