. 2017 Feb;49(2):303-309.
doi: 10.1038/ng.3748. Epub 2016 Dec 26.

Robust and scalable inference of population history from hundreds of unphased whole genomes

Affiliations

Robust and scalable inference of population history from hundreds of unphased whole genomes

Jonathan Terhorst et al. Nat Genet. 2017 Feb.

Abstract

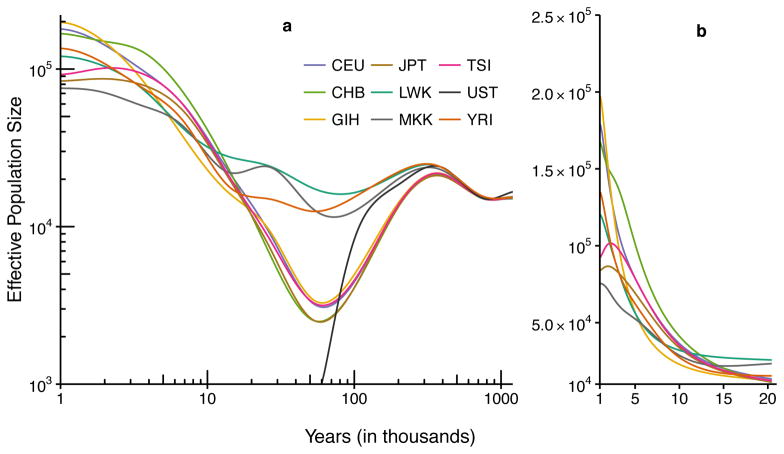
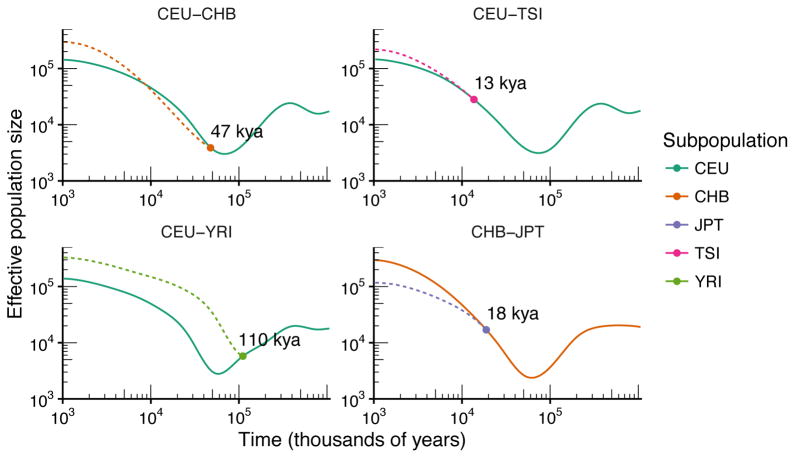
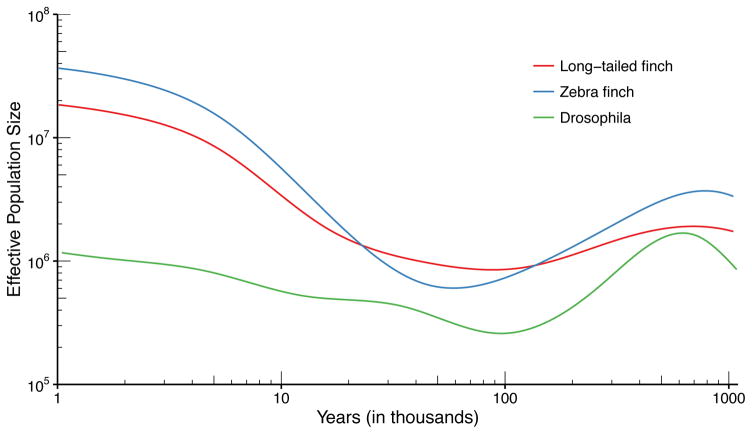
It has recently been demonstrated that inference methods based on genealogical processes with recombination can uncover past population history in unprecedented detail. However, these methods scale poorly with sample size, limiting resolution in the recent past, and they require phased genomes, which contain switch errors that can catastrophically distort the inferred history. Here we present SMC++, a new statistical tool capable of analyzing orders of magnitude more samples than existing methods while requiring only unphased genomes (its results are independent of phasing). SMC++ can jointly infer population size histories and split times in diverged populations, and it employs a novel spline regularization scheme that greatly reduces estimation error. We apply SMC++ to analyze sequence data from over a thousand human genomes in Africa and Eurasia, hundreds of genomes from a Drosophila melanogaster population in Africa, and tens of genomes from zebra finch and long-tailed finch populations in Australia.


Conflict of interest statement

COMPETING FINANCIAL INTERESTS

The authors declare no competing financial interests.

Figures

Figure 1
Figure 1. The effect of phasing error
The true population size history is indicated by a bold black line, while colored lines indicate inferred histories for ten simulations each with sample size n = 4. For MSMC, switch error was introduced at the rate of 0%,1%, or 5%, indicated in parenthesis in the legend. SMC++ does not require phased data and its results are insensitive to phasing errors. With phasing error, MSMC estimates can be off by orders of magnitude in the recent past. In the absence of phasing error, the accuracy of MSMC is comparable to that of SMC++, with SMC++ producing higher resolution in the recent past.
Figure 2
Figure 2. Performance of SMC++ compared to MSMC and ∂ai
(a) The sawtooth demography. (b) The recent-expansion demography. Each method was used to analyze ten simulated datasets generated according to the demography shown in black. SMC++ was given sequence data from n = 100 lineages, and ∂ai analyzed the SFS from that data set. MSMC analyzed n = 8 of those lineages, the largest sample size for which it successfully ran. For this simulation, we introduced switch errors at a rate of 1% at segregating sites. All plots are on the same axes to aid in comparing the methods, but note that the MSMC fits again diverged to very large values (as high as O(1010)) in the recent past. (MSMC and ∂ai use the same breakpoints from run to run; we jittered the x-values of the fits slightly to prevent overlaying.)
Figure 3
Figure 3. SMC++ results of jointly inferring population size histories and divergence times
Two populations were simulated under the “recent-expansion” demography described above. Each population consisted of n = 10 lineages. Different colors correspond to different divergence times. From the point of divergence until present, population 2 maintains a constant effective population size equal to the value it had at the time of the split. The solid colored lines indicate the inferred demography for population 1, which should follow the solid black line indicating the simulated demography. The dashed colored lines indicate the inferred demography for population 2, which should be flat from the time of the split onwards. The vertical dotted lines represent the true value of the split, whereas solid dots in corresponding color represent the value of the inferred split time. This result shows that our method is able to infer divergence times with low error over a wide range of split times, spanning approximately 6–120 kya.
Figure 4
Figure 4. Computational performance of SMC++, MSMC, and ∂ai
The plots show median memory usage and runtime; error bars denote interquartile range. Each datum comprises ten repetitions on 3Gb of simulated data. The largest sample size for which we were able to successfully run MSMC was n = 8. For large sample sizes (n ≥ 8), SMC++ requires orders of magnitude less memory and time than does MSMC. The lower and upper hinges represent 25th and 75th percentiles; the middle line is the median. Whiskers extend to the nearest observation less than 1.5IQR beyond the corresponding hinges.
Figure 5
Figure 5. Results of effective population size inference across eight extant human populations and an ancient Ust’-Ishim individual
A generation time of 29 years was used to convert the coalescent scaling to calendar time. (a) Results for all populations on a log-log scale. Plot assumes that the Ust’-Ishim individual lived until 45 kya. (b) Results for present-day populations on a linear scale over the past 20 ky. See Supplementary Table 2 for a description of the populations and sample sizes.
Figure 6
Figure 6. Inference of split times in modern humans
Results of jointly estimating population size histories and split times in a two-population model. The same data and generation times as in Fig. 5 were used to generate the plot.
Figure 7
Figure 7. Results of effective population size inference for two finch species and D. melanogaster
Generation times of 3 months (finch) and 1 month (D. melanogaster) were used to convert the coalescent scaling to calendar time. See Supplementary Table 3 for a description of the populations and sample sizes.

References

    1. Tennessen JA, et al. Evolution and functional impact of rare coding variation from deep sequencing of human exomes. Science. 2012;337:64–69. - PMC - PubMed
    1. 1000 Genomes Project Consortium. A map of human genome variation from population-scale sequencing. Nature. 2010;467:1061–1073. - PMC - PubMed
    1. Skoglund P, et al. Genetic evidence for two founding populations of the Americas. Nature. 2015;525:104–108. - PMC - PubMed
    1. Raghavan M, et al. Genomic evidence for the Pleistocene and recent population history of Native Americans. Science. 2015;349:aab3884. - PMC - PubMed
    1. Huerta-Sanchez E, et al. Altitude adaptation in Tibetans caused by introgression of Denisovan-like DNA. Nature. 2014;512:194–197. - PMC - PubMed

LinkOut - more resources