. 2017 Feb;20(2):189-199.
doi: 10.1038/nn.4467. Epub 2016 Dec 26.

Developmental broadening of inhibitory sensory maps

Affiliations

Developmental broadening of inhibitory sensory maps

Kathleen B Quast et al. Nat Neurosci. 2017 Feb.

Abstract

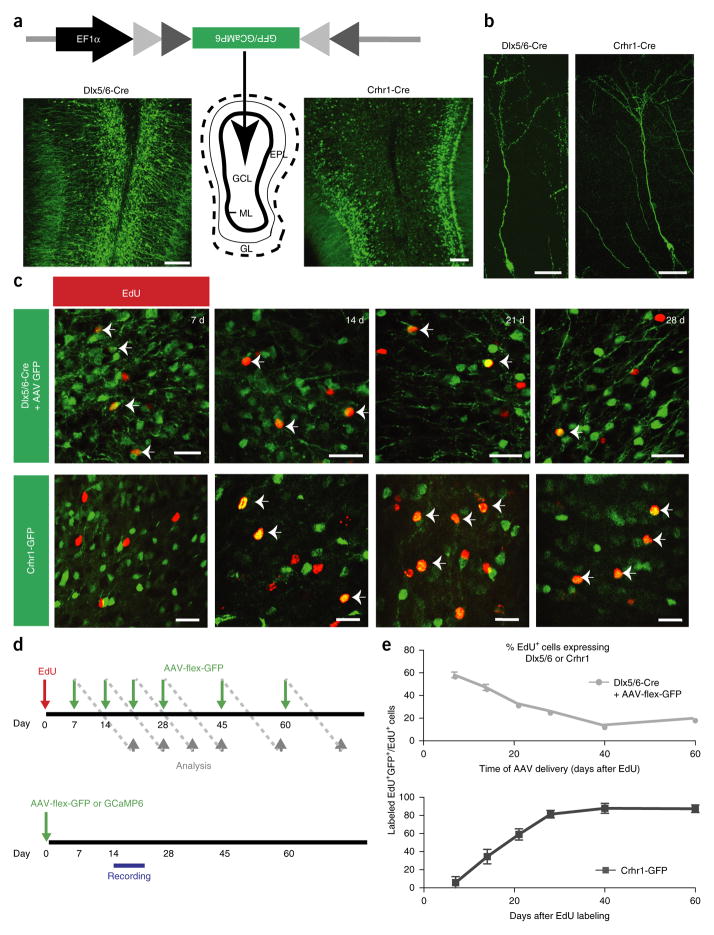
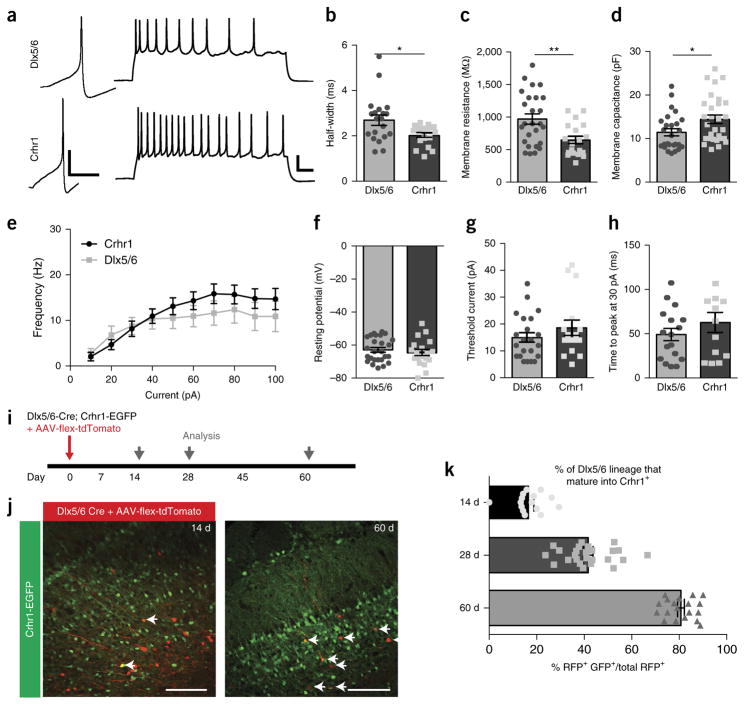
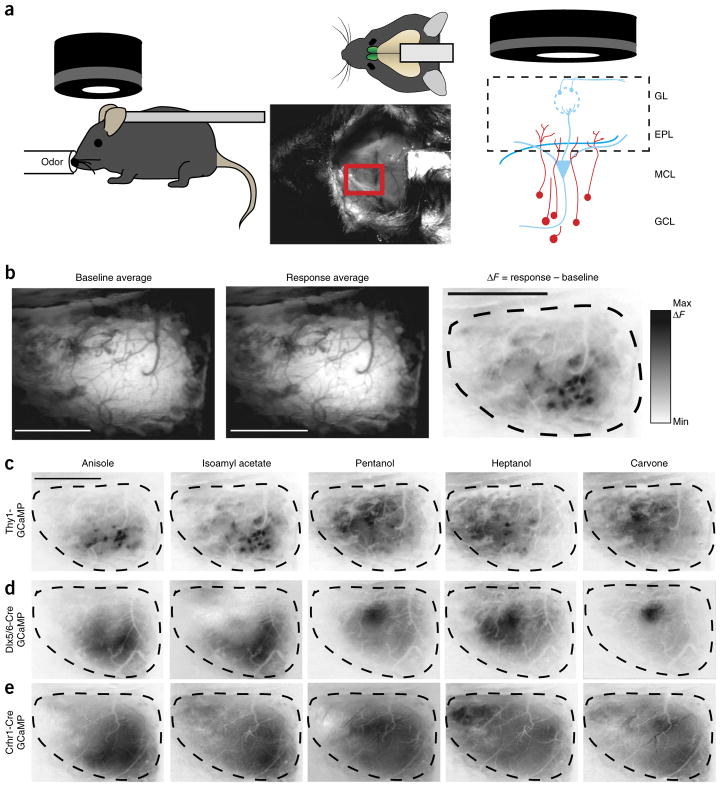
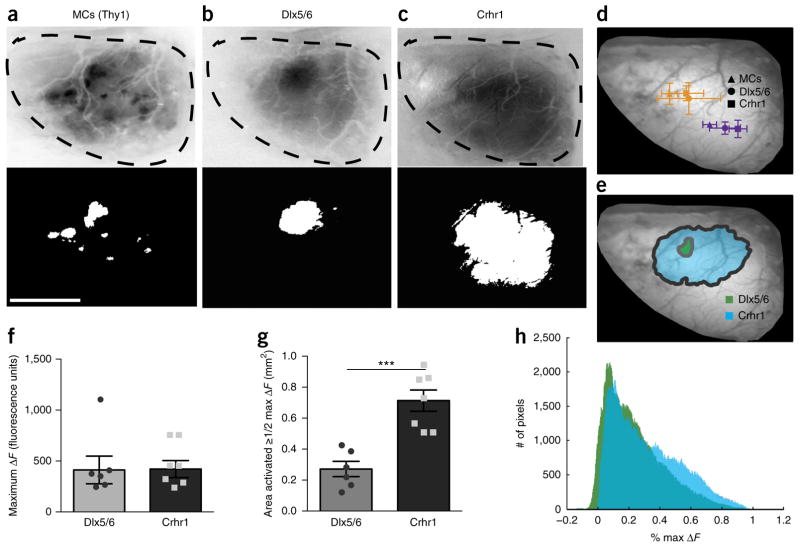
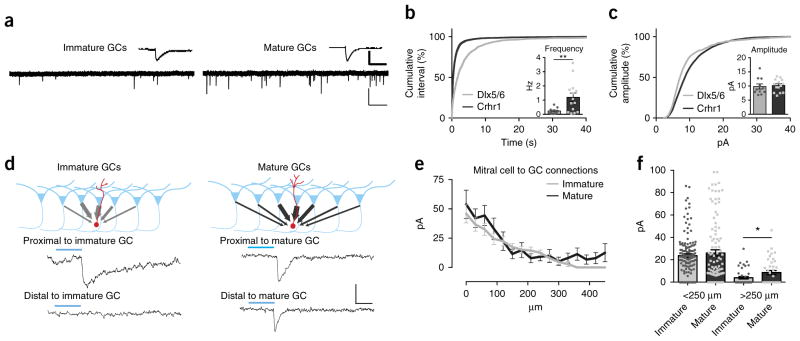
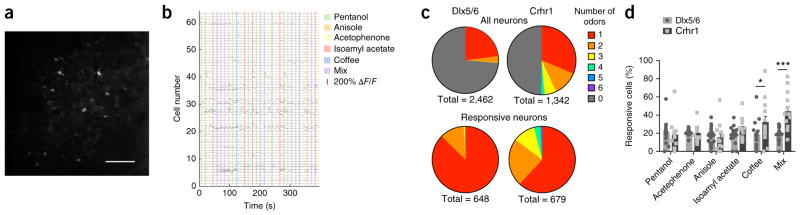
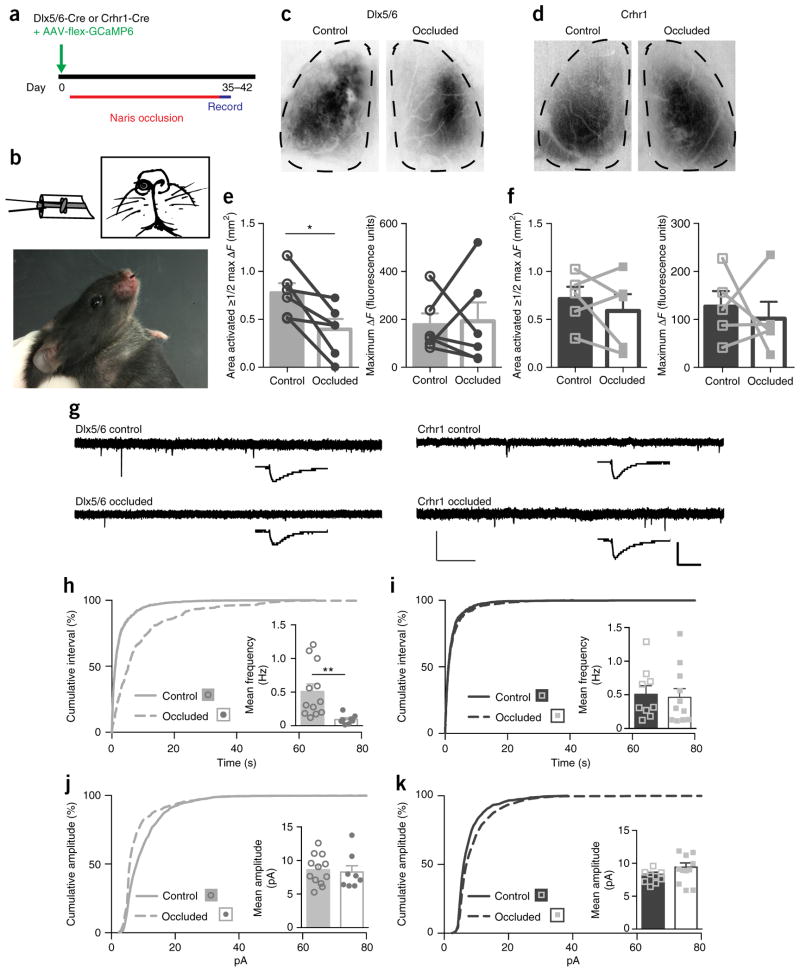
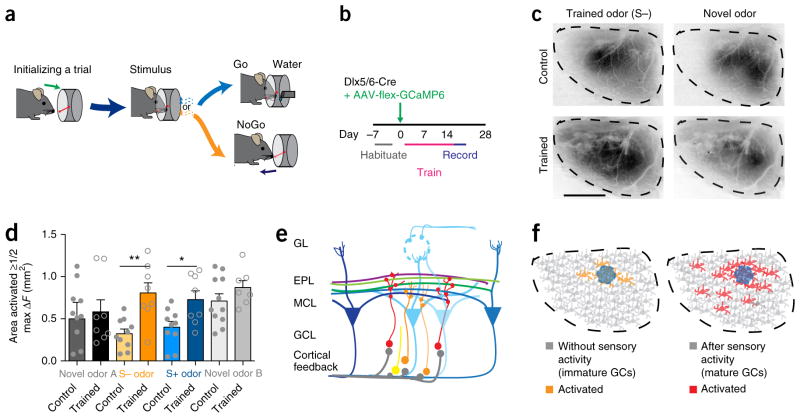
Sensory maps are created by networks of neuronal responses that vary with their anatomical position, such that representations of the external world are systematically and topographically organized in the brain. Current understanding from studying excitatory maps is that maps are sculpted and refined throughout development and/or through sensory experience. Investigating the mouse olfactory bulb, where ongoing neurogenesis continually supplies new inhibitory granule cells into existing circuitry, we isolated the development of sensory maps formed by inhibitory networks. Using in vivo calcium imaging of odor responses, we compared functional responses of both maturing and established granule cells. We found that, in contrast to the refinement observed for excitatory maps, inhibitory sensory maps became broader with maturation. However, like excitatory maps, inhibitory sensory maps are sensitive to experience. These data describe the development of an inhibitory sensory map as a network, highlighting the differences from previously described excitatory maps.


Conflict of interest statement

COMPETING FINANCIAL INTERESTS

The authors declare no competing financial interests.

Figures

Figure 1
Figure 1
Genetically targeting populations of granule cells in the adult olfactory bulb. (a) Diagram of viral targeting of granule cells showing representative cross-sections from Dlx5/6-Cre (left) and Crhr1-Cre (right) mice labeled with AAV-flex-GFP. GCL, granule cell layer; ML, mitral cell layer; EPL, external plexiform layer; GL, glomerular layer; scale bars, 50 μm. (b) Individual granule cells labeled with conditional virus. Scale bars, 25 μm. (c) High magnification view of Dlx5/6-Cre AAV-flex-GFP or Crhr1-GFP labeled olfactory bulbs 7, 14, 21 and 28 d after EdU injection. EdU+GFP+ cells as a fraction of EdU+ cells (arrows) decrease with maturation in the Dlx5/6-Cre mice and increase with maturation in the Crhr1-GFP mice. Scale bars, 15 μm. (d) Top, timeline of birthdating experiments. Green arrows indicate day of viral injection, when each mouse received a single injection. Gray arrows indicate when labeled animals were killed. Bottom, timeline for imaging and electrophysiology. Mice received a single injection and then imaging or recording occurred between 14–21 d after viral injection unless otherwise specified. (e) Quantification of Dlx5/6 (top) and Crhr1 (bottom, modified from Garcia et al.) expression data generated as in c in newborn neurons (data points represent averages ± s.e.m., n = 4 Dlx5/6-Cre, 3 Crhr1-Cre, 4–6 olfactory bulbs per time point, 5 slices per olfactory bulb).
Figure 2
Figure 2
Comparison of membrane and firing properties of functionally immature Dlx5/6 versus functionally mature Crhr1 granule cells. (a) Left, single action potentials in Dlx5/6-Cre AAV-flex-GFP+ neurons (top) and Crhr1-Cre AAV-flex-GFP+ neurons (bottom) at threshold current (10 pA). Scale bars 20 mV, 50 ms. Right, train of action potentials in response to 1 s of 50 pA current injection in Dlx5/6-expressing (top) and Crhr1-expressing (bottom) neurons at threshold current. Scale bars 20 mV, 50 ms. (b) Half-widths of action potentials in the immature Dlx5/6-expressing neurons are significantly larger than in the more mature Crhr1-expressing neurons (two-tailed t-test, Welch’s correction, *P = 0.0129, t = 2.66, d.f. = 27). (c,d) Membrane resistances of Dlx5/6-expressing neurons (c) are significantly higher than Crhr1-expressing neurons (two-tailed t-test, Welch’s correction, **P = 0.0017, t = 3.35, d.f. = 42), whereas membrane capacitances (d) are significantly lower (two-tailed t-test, Welch’s correction, *P = 0.0241, t = 2.32, d.f. = 52). (e) Frequency–current curves for the two populations of granule cells for average number of spikes after 1 s depolarizing current injections (10 pA steps). (fh) There was no change in the resting potential (f) (two-tailed t-test, Welch’s correction, P = 0.4493, t = 0.76, d.f. = 36), current required to fire and action potential from resting potential (g) (two-tailed t-test, Welch’s correction, P = 0.2889, t = 1.083, d.f. = 26), or time to action potential peak from threshold voltage (h) (two-tailed t-test, Welch’s correction, P = 0.4493, t = 1.025, d.f. = 21), between Dlx5/6 and Crhr1-expressing neurons. (i) Experimental time line to determine when immature Dlx5/6-expressing neurons begin to express CHRH. (j,k) Example images (j) of Dlx5/6-Cre;Crhr1-GFP bulbs injected with AAV-flex-tdTomato at 14 d (left) and 60 d (right) after injection, with data quantification (k). Scale bars, 100 μm. Data points represent averages ± s.e.m.; for electrophysiology (ah), n = 26 Dlx5/6 cells from 7 mice, n = 19 Crhr1 cells from 6 mice; for staining (j,k), n = 4 bulbs, 3–5 slices per bulb, per time point.
Figure 3
Figure 3
Olfactory sensory maps from different populations of olfactory bulb neurons visualized through calcium imaging. (a) In vivo imaging of entire dorsal olfactory bulb surface (red rectangle) in anesthetized, head-fixed mice. Epifluorescence detects intensity changes of GCaMP-expressing dendrites in the olfactory bulb (right). GCL, granule cell layer; MCL, mitral cell layer; EPL, external plexiform layer; GL. glomerular layer. (b) Olfactory response sensory maps (right) are created from averaging across 3 trials (top left) per animal and then subtracting the temporal average of the baseline fluorescence (left) from the response average (middle). Scale bars, 1 mm. (ce) Example response maps to five different odorants; scale bar, 1 mm. (c) Response maps (as in b) for a Thy1-GCaMP3 mouse shows mitral and tufted cell dendrite activation displaying glomerular activation patterns. Immature (d) and mature (e) granule cell maps, in a Dlx5/6-Cre AAV-flex-GCaMP6 mouse and a Crhr1-Cre AAV-flex-GCaMP6 mouse, respectively, show more diffuse odor-dependent areas of activation.
Figure 4
Figure 4
Inhibitory sensory maps broaden with maturation. (ac) Example sensory map for pentanol (top) and the area activated at 50% or more of the maximal change in fluorescence (50% maximal ΔF) (bottom) for mitral cells (MCs) in the Thy1-GCaMP3 (a), Dlx5/6-Cre AAV-flex-GCaMP6 (b) and Crhr1-Cre AAV-flex-GCaMP6 (c) mice. Scale bar, 1 mm. (d) Average centroid location of the activated area for pentanol (orange) and anisole (purple) across the different neuronal populations: mitral cells (triangles), immature granule cells (circles) and mature granule cells (squares). (e) Consensus maps for all animals of the activated area (see Online Methods). (f) No change in maximal ΔF value across animals (two-tailed t-test, P = 0.9557, t = 0.06, d.f. = 11). (g) Significant increase in the activated area (50% or more of maximal ΔF) for the mature granule cells (two-tailed t-test, P = 0.0004, t = 5.06, d.f. = 11). (h) Histogram of change in fluorescence intensity values normalized to maximal ΔF for all pixels from the pentanol sensory maps. Bars represent averages ± s.d. (d) or s.e.m. (f,g); n = 6 animals for Dlx5/6-Cre, n = 7 animals for Crhr1-Cre and n = 4 animals for Thy1-GCaMP, minimum of 3 trials per odorant.
Figure 5
Figure 5
Mature granule cells show recruitment over refinement of synaptic inputs. (a) Representative traces and average event (top insets) of mEPSCs from an immature Dlx5/6-Cre AAV-flex-GFP neuron (left) and a mature Crhr1-Cre AAV-flex-GFP neuron (right). Scale bars: full trace (light bars) 20 pA, 1 s; average (heavy bars) 8 pA, 11 ms. (b) Cumulative distribution plot of inter-event interval. mEPSCs are significantly different between Dlx5/6 and Crhr1-expressing neurons (KS test, P < 0.0001, D = 0.36). Inset: mean frequency of mEPSCs from immature Dlx5/6 and mature Crhr1 granule cells (two-sided t-test, Welch’s correction, P = 0.0065, t = 3.20, d.f. = 13). (c) Cumulative distribution plot. Amplitudes of the mEPSCs are significantly different between Dlx5/6 and Crhr1 neurons (KS test, P < 0.0001, D = 0.16). Inset: mean amplitude of mEPSCs of immature Dlx5/6 and mature Crhr1 granule cells (n = 13 granule cells from 5 Dlx5/6 animals and 11 granule cells from 5 Crhr1 animals). (d) Top: optogenetic mapping of mitral cell inputs onto granule cells. Bottom: example traces of laser-evoked excitatory currents onto immature neurons (right, from Thy1-ChR2; Dlx5/6-Cre animals recorded 2–3 weeks after injection) and mature neurons (left, from Thy1-ChR2;Dlx5/6-Cre animals recorded 5–6 weeks after injection), highlighting stimulation of areas either proximal (<250 μm; top) or distal (<250 μm; bottom) to the recorded cell. Scale bars 15 pA, 10 ms. (e) Average connection strength as a function of lateral distance from the granule cell. (f) Mature granule cells receive stronger input from distal connections (two-sided t-test, * P = 0.0326, n = 8 cells per group). Bar graphs in b,c,e,f represent mean values ± s.e.m.
Figure 6
Figure 6
Individual granule cells respond to more odors with maturation. (a) Single frame of in vivo two-photon GCaMP signal from Crhr1-expressing cells imaged 350 μm deep. Scale bar, 100 μm. (b) ΔF/F traces from neurons in a. (c) Number of odorants neurons responsive as a fraction of all imaged neurons within a single plane (top) or as a fraction of responsive neurons within a single plane (bottom). (d) Quantification of neurons responding to individual odors as a percentage of cells that responded to any odor (two-way ANOVA, Sidak’s multiple comparison correction, *P = 0.0274, t = 2.87, d.f. = 174; ***P < 0.0001, t = 5.06, d.f. = 174). Bars are mean percent per imaging plane ± s.e.m., 2–5 planes per animal, 3 animals each genotype injected with AAV-flex-GCaMP6 virus and imaged 2–3 weeks after injection.
Figure 7
Figure 7
Decreased sensory experience prevents sensory map expansion. (a) Timeline for removable unilateral naris occlusion experiments. (b) Diagram of the nose plug as described by Cummings et al., made from polyethylene tubing, and photo of inserted nose plug. (cf) Naris occlusion prevents expansion of the area activated (to 50% or more of max ΔF) in the immature (Dlx5/6-Cre AAV-flex-GCaMP6) cells (c, quantified in e; two-tailed paired t-test, P = 0.0111, t = 2.90, d.f. = 15), but does not change the activated area of the mature (Crhr1+ AAV-flex-GCaMP6) cells (d, quantified in f; two-tailed t-test, P = 0.4236, t = 0.89, d.f. = 5). Naris occlusion does not change the maximal ΔF for either maturation state (e,f). Data points represent the occluded or control bulb from individual animals; bars show mean values ± s.e.m. (g) Representative traces of mEPSC recordings from Dlx5/6 (left) and Crhr1 (right) granule cells after 5–6 weeks of naris occlusion in control or occluded bulbs. Scale bars: full trace (light bars) 20 pA, 1 s; average (heavy bars) 8 pA, 10 ms. (h,i) Cumulative distribution of inter-event interval of the mEPSCs are significantly different for the Dlx5/6-expressing cells (KS test, P < 0.0001, D = 0.45). Insets: mean frequency of mEPSCs of immature Dlx5/6-expressing and mature Crhr1-expressing granule cells (two-sided t-test, Welch’s correction, **P = 0.0038, t = 3.58, d.f. = 12). (j,k) Cumulative distributions of amplitude of the mEPSCs are significantly different for the two types (KS test, j: P < 0.0001, D = 0.23, k: P < 0.0001, D = 0.12). Inset: mean amplitude of mEPSCs of immature Dlx5/6 and mature Crhr1 granule cells. Bar graphs in hk represent mean values ± s.e.m.; for mEPSC data: n = 13 control granule cells and 8 occluded cells from 4 animals for Dlx5/6 and n = 12 control granule cells and 11 occluded from 4 animals for Crhr1.
Figure 8
Figure 8
Olfactory learning precociously expands inhibitory sensory maps. (a) Timeline and (b) experimental set up for the Go/No Go odor learning task. (c) Representative ΔF sensory map from Dlx5/6-Cre AAV-flex-GCaMP6 control and trained mice in response to the unrewarded trained odor (pentanol; S−) and a novel odor (acetophenone). Scale bar, 1 mm. (d) After training, the activated area (50% or more of max ΔF) is significantly increased for the training-associated rewarded (S+) and unrewarded (S−) odors but not novel odors (one-way ANOVA, Sidak’s multiple correction, *P = 0.0493, t = 2.31, d.f. = 48; **P = 0.0028, t = 3.40, d.f. = 48; bars represent mean values ± s.e.m., n = 8 animals trained, 10 animals control). (e) Diagram of lateral dendrites from mitral cells activated by distant glomeruli synapsing (red circles) with mature granule cells (red) while immature granule cells (orange) receive fewer synapses (orange circles) from local cortical or proximal mitral cell synapses. (f) Model of activated granule cells (GCs) in animals with immature or minimal sensory experience (left) and mature or increased sensory experience (right). Colored neurons are activated by the same stimulus, which also activates the nearby glomerulus (blue circle).

Comment in

References

    1. Markram H, et al. Interneurons of the neocortical inhibitory system. Nat Rev Neurosci. 2004;5:793–807. - PubMed
    1. Cang J, Feldheim DA. Developmental mechanisms of topographic map formation and alignment. Annu Rev Neurosci. 2013;36:51–77. - PubMed
    1. Iwasato T, et al. NMDA receptor-dependent refinement of somatotopic maps. Neuron. 1997;19:1201–1210. - PubMed
    1. Gordon JA, Stryker MP. Experience-dependent plasticity of binocular responses in the primary visual cortex of the mouse. J Neurosci. 1996;16:3274–3286. - PMC - PubMed
    1. Ackman JB, Burbridge TJ, Crair MC. Retinal waves coordinate patterned activity throughout the developing visual system. Nature. 2012;490:219–225. - PMC - PubMed

Publication types

LinkOut - more resources