. 2017 Jan 12;541(7636):237-241.
doi: 10.1038/nature20781. Epub 2016 Dec 26.

Variable chromatin structure revealed by in situ spatially correlated DNA cleavage mapping

Affiliations

Variable chromatin structure revealed by in situ spatially correlated DNA cleavage mapping

Viviana I Risca et al. Nature. .

Abstract

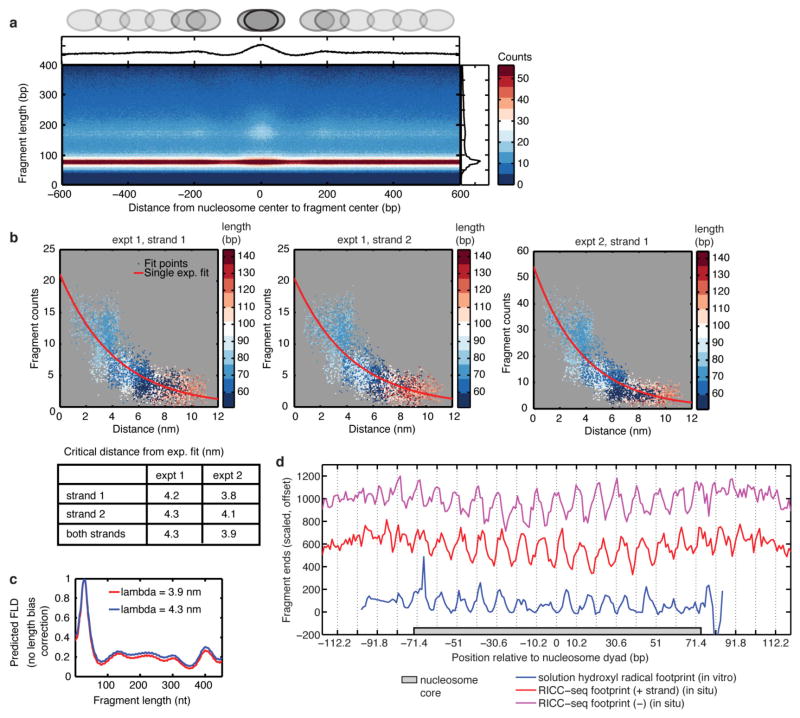
Chromatin structure at the length scale encompassing local nucleosome-nucleosome interactions is thought to play a crucial role in regulating transcription and access to DNA. However, this secondary structure of chromatin remains poorly understood compared with the primary structure of single nucleosomes or the tertiary structure of long-range looping interactions. Here we report the first genome-wide map of chromatin conformation in human cells at the 1-3 nucleosome (50-500 bp) scale, obtained using ionizing radiation-induced spatially correlated cleavage of DNA with sequencing (RICC-seq) to identify DNA-DNA contacts that are spatially proximal. Unbiased analysis of RICC-seq signal reveals regional enrichment of DNA fragments characteristic of alternating rather than adjacent nucleosome interactions in tri-nucleosome units, particularly in H3K9me3-marked heterochromatin. We infer differences in the likelihood of nucleosome-nucleosome contacts among open chromatin, H3K27me3-marked, and H3K9me3-marked repressed chromatin regions. After calibrating RICC-seq signal to three-dimensional distances, we show that compact two-start helical fibre structures with stacked alternating nucleosomes are consistent with RICC-seq fragmentation patterns from H3K9me3-marked chromatin, while non-compact structures and solenoid structures are consistent with open chromatin. Our data support a model of chromatin architecture in intact interphase nuclei consistent with variable longitudinal compaction of two-start helical fibres.


Conflict of interest statement

The authors declare competing financial interests: details are available in the online version of the paper.

Figures

Extended Data Figure 1
Extended Data Figure 1. RICC-seq library preparation workflow
Cells lysed in agarose plugs after irradiation are processed within the plugs to avoid mechanical shear of DNA. The 3′ phosphate ends (and all phosphates) are removed by alkaline phosphatase treatment, then 5′ phosphates are added back by polynucleotide kinase (T4 PNK) in preparation for ligation. Short 5′ phosphorylated ssDNA fragments are then passively eluted from agarose plugs after thermal denaturation and incorporated into paired-end sequencing libraries by ligation of random hexamer overhang adapters. Adaptor dimers are removed by size selection before and after PCR amplification of libraries.
Extended Data Figure 2
Extended Data Figure 2. Reproducibility, sequence bias, robustness to crosslinking, and genome coverage of RICC-seq data sets
a, Irradiated cell samples (300 Gy and 0 Gy) compared between two technical replicates and 300 Gy fragment size distributions compared after subtraction of scaled 0 Gy histograms. b, Fragment size distributions compared between three biological replicates. Owing to their low random DNA cleavage baselines, experiments 1 and 2 were used for genome-wide fragment length profile analysis and calibration of the exponential cleavage model (Figs 2–4). Experiment 3 has a higher background of non-specific breaks, probably because of mild nuclease contamination during the plug processing steps of the protocol. Although the low signal-to-background ratio of this experiment led us to exclude it from genome-wide distribution analysis, we did include it in V-plot and footprint generation to obtain higher sequencing coverage of ~78 bp fragments (Fig. 1 and Extended Data Fig. 3). Background subtraction of 0 Gy signal is as in a. c, Fragment end sequence bias for all irradiation conditions in an experiment with machine-mixed random hexamer adaptor oligonucleotides. d, Fragment end sequence bias in biological replicate processed with hand-mixed random hexamer adaptor oligonucleotides. e, Raw fragment size distributions obtained from live and formaldehyde/EGS-crosslinked cells (subsampled to same sequencing depth). f, Normalized expected RICC-seq fragment density from cellular chromatin (red) or dechromatinized DNA (black) estimated by dividing the number of fragments within annotated peaks by the number within size-matched control regions elsewhere in the genome (error bars represent s.e.m. with n =3 independent experiments; centre value is mean). g, Ratio of cellular fragment density ratio to genomic DNA fragment density ratio from f. h, P values for comparisons in g (Mann–Whitney U test; n =3 biological replicates).
Extended Data Figure 3
Extended Data Figure 3. RICC-seq produces characteristic 78 nt fragments around positioned nucleosomes and protection footprints at CTCF-bound sites
a, V-plot of dechromatinized DNA control for Fig. 1f. b, V-plot of RICC-seq fragments from cells around unoccupied CTCF motifs without a CTCF ChIP-seq peak (see Methods). c, Difference in counts of RICC-seq fragment ends piled up over aggregated CTCF motifs within (bound) or outside (not bound) ChIP peaks. d, V-plot of cell and dechromatinized DNA around active (associated with RNA-CAGE peaks) transcription start sites (see Methods). e, V-plot of cell fragments around inactive TSSs (lacking an ATAC-seq peak in BJ fibroblasts). Grey ovals are cartoon representations of nucleosome positions and phasing. Data for all panels were pooled from three biological replicates.
Extended Data Figure 4
Extended Data Figure 4. Calculation of FLFE normalizes sequence bias in the RICC-seq fragment size distribution throughout the genome
a, Workflow for calculating and normalizing FLFE. b, Fragment length distributions in 1 Mb windows sorted by GC content. c, FLFE with respect to lookup table of GC content-binned genome-wide average FLD in equal-sized windows. d, Z-scores of chromatin annotations in same 1 Mb windows. See Methods for annotation details. Data are pooled from two biological replicates.
Extended Data Figure 5
Extended Data Figure 5. FLFE PC1 and regional profiles are reproducible across biological replicates
a, PC1 calculated independently from each of two biological replicates. b, Region FLFE profiles calculated for additional annotations. ATAC-seq, H3K9me3-only, and H3K27me3 (excluding H3K9me3 or H3K4me1) are as in Fig. 2. Euchromatin-associated annotations are on a blue background. c, For two annotation regions, reproducibility of regional FLFE profiles between two biological replicates is shown in terms of the raw FLFE profiles (top), the FLFE in de-chromatinized DNA samples that quantifies sequence bias (middle), and the GC baseline normalized FLFE (bottom). Grey shaded areas represent peaks as in Fig. 1.
Extended Data Figure 6
Extended Data Figure 6. PC1 signal is correlated with ATAC-seq signal and anti-correlated with H3K9me3 ChIP signal
a, b, Example tracks of RICC-seq PC1 signal for combined biological replicates and each replicate separately in the same region of chromosome 5 as in Fig. 2 (at higher zoom) and in a region of chromosome 3. c, Correlation between replicates for PC1 score. d, Correlation of PC1 score from combined replicates with euchromatic (ATAC-seq) and heterochromatic (H3K9me3 or H3K27me3) annotations in 300 kb windows. ATAC-seq data are shown as insertion density, while H3K9me3 and H3K27me3 signals are shown as −log10(Poisson P value over local background) (see Methods).
Extended Data Figure 7
Extended Data Figure 7. Fragment length bias correction. Bias was corrected by comparing fragment size distributions between sequencing data
(a) and intensity profiles from 5′ end-labelled denaturing gel electrophoresis of RICC-seq ssDNA fragments before sequencing library preparation (b). c, End-labelled fragments have a length distribution weighted more towards long fragments. d, The ratio of the two distributions (sequencing/gel) was calculated and smoothed, then (e) fitted with a single exponential to obtain an estimate of the length bias. Bias estimate is shown for three biological replicates.
Extended Data Figure 8
Extended Data Figure 8. RICC-seq signal from positioned nucleosomes reflects known nucleosome structure
a, V-plot of RICC-seq fragments around ATAC-seq called nucleosome positions. b, Exponential fits of background-subtracted and length bias corrected (Extended Data Fig. 7) fragment counts to the 3D distance between the end positions of each fragment shown for individual replicates and individual strands. c, Example showing the magnitude of predicted FLD changes for a simulated fibre structure (see Methods) between the calibration values obtained from biological replicate experiments. d, Cleavage locations (fragment ends) were mapped around nucleosome dyad centres called by ATAC-seq (see Methods). Background-subtracted (0 Gy), sequencing depth, and cell-number-scaled fragment end counts are shown for the positive and negative reference genome strand. Blue trace shows cleavage frequency from in vitro hydroxyl-radical footprinted reconstituted nucleosome (scaled to comparable amplitude).
Extended Data Figure 9
Extended Data Figure 9. Clustering fibre structures into five classes on the basis of helical symmetry. a, Example fibre structure illustrating nucleosome and fibre coordinates
b, Energy (log10(kBT)) per nucleosome for each minimum-energy structure. c, Distribution of linker DNA crossing distance for each minimum-energy structure at every linker length and compaction level combination. d, e, Maps of nucleosome tilt angles (nucleosome axis relative to fibre axis) (d) and rotation angles around fibre for adjacent nucleosomes (e). f, g, Distance between centres of second-nearest-neighbour (f, N to N + 2) and third-nearest-neighbour (g, N to N + 3) nucleosomes in each fibre model. h, Hierarchical clustering of the 969 candidate structures into five classes on the basis of the distribution of nucleosome centre distances for intervals between N to N + 1 (adjacent nucleosomes) and N to N + 7. The matrix was row-standardized before clustering to measure the relative intensity of contact distances for each structure. Classes are coloured as in Fig. 4b. i, Mean with bands (one s.d.) of predicted FLFE plotted for each class of structure. j, Mean energy of the structures in each class. k, Comparison of predicted FLD between a solenoid structure and an extended zig-zag structure without length bias correction for 51–2,000 bp fragments. l, Measured RICC-seq FLD beyond 500 nt before (left) and after (right) subtraction of an exponential baseline. k, Comparison of predicted FLD between a solenoid structure and an extended zig-zag structure without length bias correction for 51–2,000 bp fragments. m, Example FLFEs of structure models with varying linker length. n, Example FLFEs of structure models with varying compaction level.
Extended Data Figure 10
Extended Data Figure 10. Two-start helix structures (class 1) are consistent with genome-wide average chromatin structure, facultative heterochromatin, and a reconstituted fibre containing linker histone, while bent linkers are consistent with open chromatin
a, Map of similarity scores between the predicted FLFEs of simulated fibre structures and the genome-wide experimental FLFE, shown in c, measured as the ratio of the genome-wide FLD to the genome-wide dechromatinized DNA FLD. b, Mean similarity scores as calculated in a for each structure class. c, Genome-wide experimental FLFE calculated with respect to the dechromatinized DNA FLD after a one-parameter fit to obtain equivalent scaling of read counts. d, Top view and side view of reconstituted chromatin fibre with NRL =187 bp (40 bp linker length). e, Similarity score between predicted FLDs for each simulated fibre structure and the FLFE of the reconstituted fibre structure. Linker length of the reconstituted fibre is indicated. f, Mean similarity scores from e, for each structure class. g, Predicted FLD for the reconstituted fibre and genome-wide experimental FLD. h, Fragments with characteristic lengths (red) labelled on the tetranucleosome unit of the reconstituted fibre. i, Similarity score between predicted FLFE for the fibre structure candidates and the experimental FLFE from H3K27me3 peaks with no H3K9me3 or H3K4 me1 ChIP peak overlap, with (j) averages of similarity score within clusters as in Fig. 4b. Class 1 regions (Fig. 4b) are outlined in black in a, e, and i. k, Comparison of FLFEs from H3K27me3 ChIP peaks with H3K9me3 FLFE and predicted FLFE from a high-similarity-score structure. l, Mononucleosome models built by adding 10 bp straight DNA linker pieces to achieve 30 bp linker lengths. Structures are based on the core nucleosome crystal structure, chromatosome crystal structure with linker histone H5, and a chromatin fibre with linker histone H1 (see Methods). The predicted FLD and FLFE with respect to the genome-wide aggregate FLD is shown for each structure. m, The FLFE and FLD in three chromatin states shown for comparison. n, Predicted chromatosome FLDs for extended zig-zag and solenoid structures. Curves in ln are scaled by the maximum of the 78 bp peak.
Figure 1
Figure 1. RICC-seq principle and assay
a, Gamma rays scatter electrons, generating clusters of hydroxyl radicals dispersed throughout the cell sample (cyan). DNA passing through a cluster more than once is subject to spatially correlated strand breaks (red) that generate short ssDNA fragments. b, Workflow for irradiation and ssDNA capture for sequencing (see Methods). Cyan path: de-chromatinized genomic DNA control. c, Polyacrylamide gel electrophoresis (PAGE) analysis of end-labelled ssDNA, colours as in d. d, Line scans of c. e, FLD of sequenced library; ~78 and ~177 nt fragment peaks span single nucleosomes; the ~378 nt fragment spans second-nearest-neighbour nucleosomes. f, V-plot of RICC-seq fragments around occupied CTCF motifs (see Methods; data are pooled from three biological replicates). Grey ovals: cartoon of qualitative nucleosome positions.
Figure 2
Figure 2. The RICC-seq FLD reveals variable chromatin compaction states
a, Cluster averages of 1 Mb window FLDs hierarchically clustered and plotted with average z-scores of chromatin annotations. b, First principal component of variation (PC1) calculated from 1 Mb windows (black) or cluster averages (red). c, Spearman’s correlation of annotation signal within 1 Mb windows with baseline slope (positive slope reflects skew towards longer fragment lengths) and PC1 score. d, Track depicting the RICC-seq score (red; inner product of PC1 (b) with the FLFE (Extended Data Fig. 4a) in each 300 kb window), ATAC-seq insertion density (cyan), H3 lysine methylation ChIP-seq −log10(Poisson P value) (grey for H3K27me3 and black for H3K9me3; see Methods), and RICC-seq fragment density (blue). e, FLFE in region sets for three chromatin states. Data are pooled from two biological replicates.
Figure 3
Figure 3. Spatially correlated break frequency scales exponentially with 3D distance allowing calibration of signal
a, Fragment 5′ and 3′ end locations plotted relative to nucleosome dyad (lower right triangle) and 3D distances between same pairs of phosphates on the basis of Protein Data Bank (PDB) 1KX5 (upper left triangle; see Methods). b, The 3′ end break frequency for fragments with a given 5′ end position (green arrow in a) plotted on one DNA strand of the nucleosome structure. c, Exponential fit of RICC-seq fragment counts to 3D distance between pairs of DNA backbone phosphates (both strands, pooled from two biological replicates).
Figure 4
Figure 4. RICC-seq identifies distinct classes of predicted fibre models correlated with epigenetic features
a, Example model and simulation workflow. b, Fibre model phase space indicating six geometry classes based on clustering centre–centre nucleosome distance patterns (Extended Data Fig. 9h). Dots indicate coordinates of examples of each structure class (shown below) in the phase space. Literature values for characteristic nucleosome repeat lengths (NRLs) and compaction levels are indicated. c, f, Similarity scores (inner products) between experimental FLFE in ATAC-seq peaks (c) or H3K9me3 ChIP-seq peaks (f) and the predicted FLFE of each structure. Black outline: class 1. d, g, Mean similarity scores for each class. e, Three examples of FLFE comparisons shown after mean subtraction (subt.) of each FLFE. Experimental data are from two pooled biological replicates.

References

    1. Li G, Reinberg D. Chromatin higher-order structures and gene regulation. Curr Opin Genet Dev. 2011;21:175–186. - PMC - PubMed
    1. Luger K, Dechassa ML, Tremethick DJ. New insights into nucleosome and chromatin structure: an ordered state or a disordered affair? Nature Rev Mol Cell Biol. 2012;13:436–447. - PMC - PubMed
    1. Gilbert N, et al. Chromatin architecture of the human genome: gene-rich domains are enriched in open chromatin fibers. Cell. 2004;118:555–566. - PubMed
    1. Risca VI, Greenleaf WJ. Unraveling the 3D genome: genomics tools for multiscale exploration. Trends Genet. 2015;31:357–372. - PMC - PubMed
    1. Bednar J, et al. Nucleosomes, linker DNA, and linker histone form a unique structural motif that directs the higher-order folding and compaction of chromatin. Proc Natl Acad Sci USA. 1998;95:14173–14178. - PMC - PubMed

Publication types

MeSH terms

LinkOut - more resources