. 2018 Nov 15:182:511-521.
doi: 10.1016/j.neuroimage.2016.12.067. Epub 2016 Dec 23.

Myelin volume fraction imaging with MRI

Affiliations

Myelin volume fraction imaging with MRI

Kathryn L West et al. Neuroimage. .

Abstract

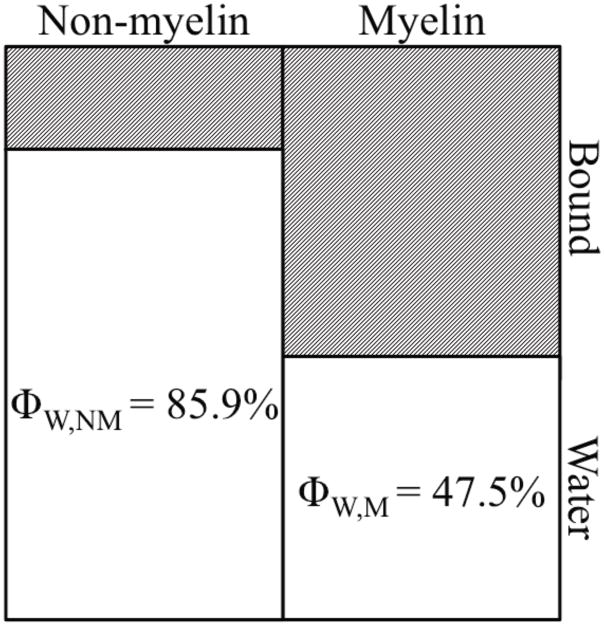
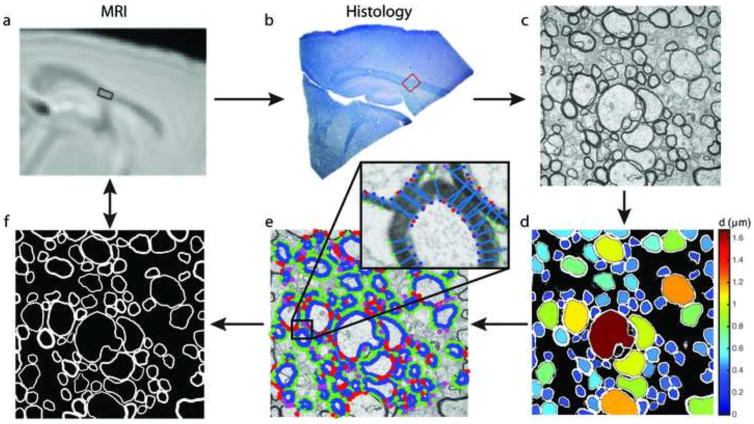
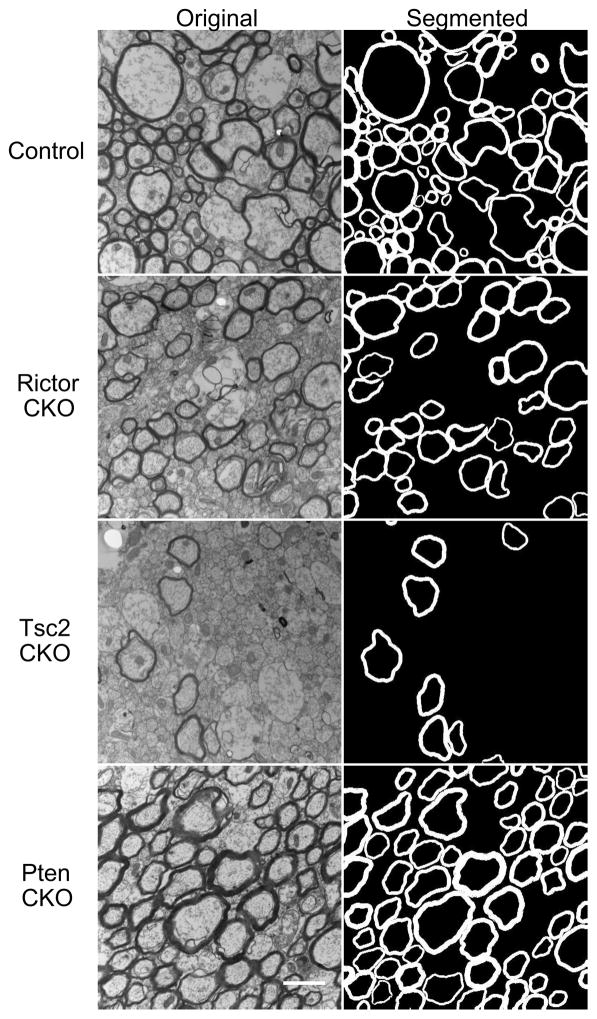
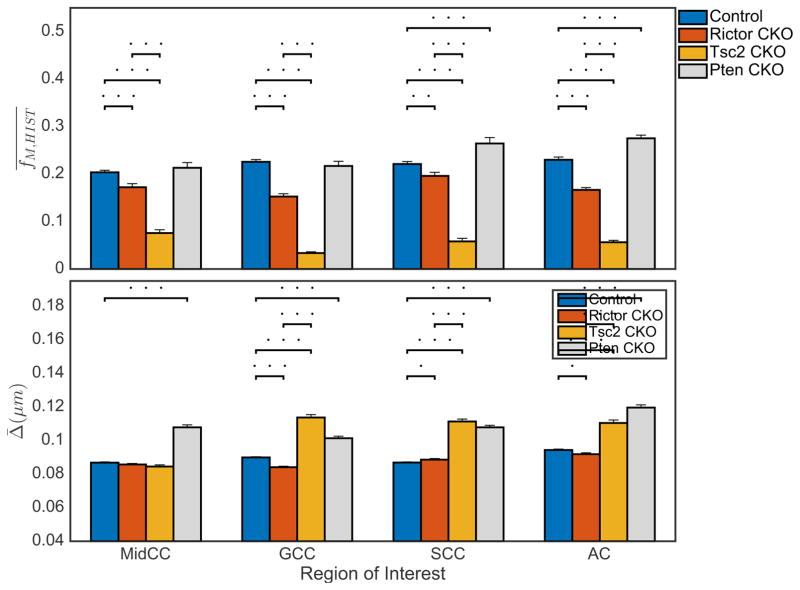
MRI is a valuable tool to assess myelin during development and demyelinating disease processes. While multiexponential T2 and quantitative magnetization transfer measures correlate with myelin content, neither provides the total myelin volume fraction. In many cases correlative measures are adequate; but to assess microstructure of myelin, (e.g. calculate the g-ratio using MRI), an accurate measure of myelin volume fraction is imperative. Using a volumetric model of white matter, we relate MRI measures of myelin to absolute measures of myelin volume fraction and compare them to quantitative histology. We assess our approach in control mice along with two models of hypomyelination and one model of hypermyelination and find strong agreement between MRI and histology amongst models. This work investigates the sensitivities of MRI myelin measures to changes in axon geometry and displays promise for estimating g-ratio from MRI.

Keywords: Histology; MRI; Magnetic resonance imaging; Myelin; Tuberous sclerosis; g-ratio.


Figures

Figure 1
Figure 1
Volumetric model of white matter. Equations 8 and 12 are used to derive accurate myelin volume fractions (fM,T2 and fM,MT) from MWF and BPF, respectively.
Figure 2
Figure 2
Histology flow chart. a) MRI T2-weighted image with box drawn for ROI analysis. b) Histology thick slice where the red box signifies the location of ultra-thin sections. c) Transmission Electron Microscopy (TEM) 15,000X image. d) Output of region-growing algorithm with color denoting axon diameter (d), and the fraction of area from all axons = fA,HIST. e) For each axon, normal lines are grown from seeds from the region-growing axon edge (blue stars) until the image value is less than the mean image value of seeds to obtain a measures of myelin thickness (green stars). The measurement is disregarded if i) the end point lands in another axon space (red stars) or ii) if the line is > 3 times median absolute deviation (magenta stars). A median myelin thickness is calculated for each axon. f) Myelin is then grown using the median thickness from the region-growing axon boundary to obtain a segmented myelin image, with the fraction of area from all myelin = fM,HIST.
Figure 3
Figure 3
Representative 15,000X (left) TEM Histology images and (right) segmented myelin images from (top-bottom) control, Rictor CKO, Tsc2 CKO, and Pten CKO mice with scale bar = 1 μm.
Figure 4
Figure 4
Region of interest (ROI) analysis of mean myelin volume fraction (fM,HIST) and mean myelin thickness (Δ̄) from (left-right) mid-body of corpus callosum (MidCC), genu of corpus callosum (GCC), splenium of corpus callosum (SCC), anterior commissure (AC) and cortical gray matter (GM) in control, Rictor CKO, Tsc2 CKO, and Pten CKO mice. Dots above bars represent significant differences of (.) = p < 0.05, (. .) = p < 0.01, (…) = p < 0.001.
Figure 5
Figure 5
Representative MRI images of (left-right) T2-weighted, long T2 component, myelin water fraction (MWF), and bound pool fraction (BPF) parameter maps from (top-bottom) control, Rictor CKO, Tsc2 CKO, and Pten CKO mice.
Figure 6
Figure 6
Region of interest (ROI) analysis of (top-bottom) long T2 component, myelin water fraction (MWF), and bound pool fraction (BPF) from (left-right) mid-body of corpus callosum (MidCC), genu of corpus callosum (GCC), splenium of corpus callosum (SCC), anterior commissure (AC) and cortical gray matter (GM) in control, Rictor CKO, Tsc2 CKO, and Pten CKO mice. Dots above bars represent significant differences of (.) = p < 0.05, (. .) = p < 0.01, (…) = p < 0.001.
Figure 7
Figure 7
(a,b) MWF and BPF versus fM,HIST with line of best fit and equations shown and line of unity (gray, dashed). r = 0.81 and 0.84, respectively. Mean standard errors from MWF and BPF are 0.007 and 0.004, respectively. (c,d) fM,T2 and fM,MT versus fM,HIST with line of best fit and equations shown and line of unity (gray, dashed). r = 0.82 and 0.84, respectively. In all cases, linear fits were statistically significant, p ≪ 0.01.
Figure 8
Figure 8
Normalized water content versus fM,HIST with line of best fit and equations shown from control, Rictor CKO, Tsc2 CKO, and Pten CKO mice, (r = −0.74). The linear fit was statistically significant, p ≪ 0.01.

References

    1. Alonso-Ortiz E, Levesque IR, Paquin R, Pike GB. Field inhomogeneity correction for gradient echo myelin water fraction imaging. Magnetic resonance in medicine 2016 - PubMed
    1. Carson R, Kelm N, West K, Does M, Fu C, Weaver G, McBrier E, Parker B, Grier M, Ess K. Hypomyelination following deletion of Tsc2 in oligodendrocyte precursors. Annals of Clinical Translational Neurology. 2015;2:1041–54. - PMC - PubMed
    1. Carson RP, Fu C, Winzenburger P, Ess KC. Deletion of Rictor in neural progenitor cells reveals contributions of mTORC2 signaling to tuberous sclerosis complex. Human Molecular Genetics. 2013;22:140–52. - PMC - PubMed
    1. Denef JF, Cordier AC, Mesquita M, Haumont S. The influence of fixation procedure, embedding medium and section thickness on morphometric data in thyroid gland. Histochemistry. 1979;63:163–71. - PubMed
    1. Does MD. Multi-Exponential Relaxation Analysis (MERA) Toolbox, Version 2. 2014 http://www.vuiis.vanderbilt.edu/~doesmd/MERA/MERA_Toolbox.html.

Publication types