. 2017 Jan;34(1):131-144.
doi: 10.1093/molbev/msw228. Epub 2016 Oct 20.

Population Parameters Underlying an Ongoing Soft Sweep in Southeast Asian Malaria Parasites

Affiliations

Population Parameters Underlying an Ongoing Soft Sweep in Southeast Asian Malaria Parasites

Timothy J C Anderson et al. Mol Biol Evol. 2017 Jan.

Abstract

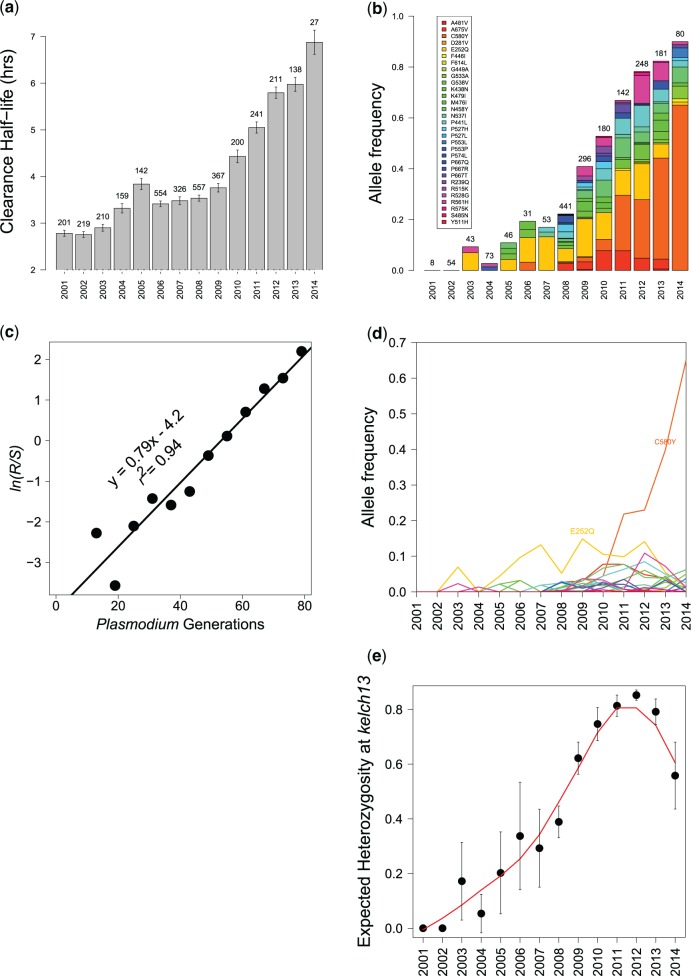
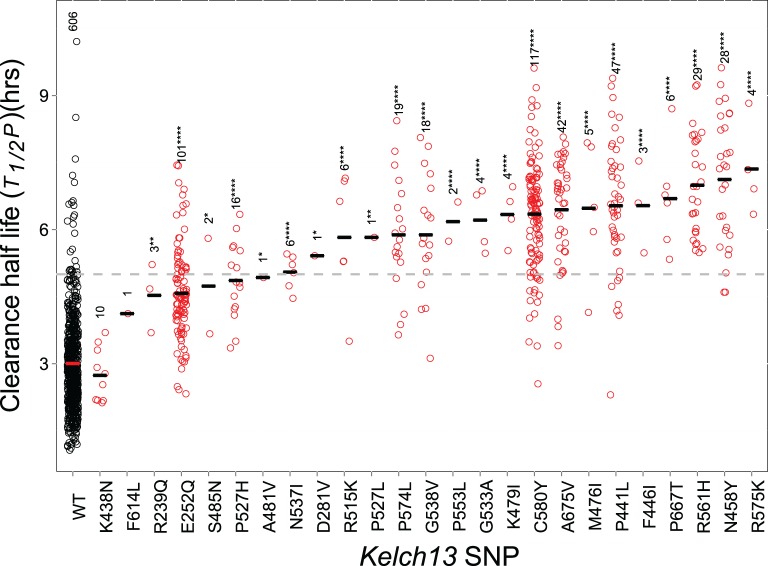
Multiple kelch13 alleles conferring artemisinin resistance (ART-R) are currently spreading through Southeast Asian malaria parasite populations, providing a unique opportunity to observe an ongoing soft selective sweep, investigate why resistance alleles have evolved multiple times and determine fundamental population genetic parameters for Plasmodium We sequenced kelch13 (n = 1,876), genotyped 75 flanking SNPs, and measured clearance rate (n = 3,552) in parasite infections from Western Thailand (2001-2014). We describe 32 independent coding mutations including common mutations outside the kelch13 propeller associated with significant reductions in clearance rate. Mutations were first observed in 2003 and rose to 90% by 2014, consistent with a selection coefficient of ∼0.079. ART-R allele diversity rose until 2012 and then dropped as one allele (C580Y) spread to high frequency. The frequency with which adaptive alleles arise is determined by the rate of mutation and the population size. Two factors drive this soft sweep: (1) multiple kelch13 amino-acid mutations confer resistance providing a large mutational target-we estimate the target is 87-163 bp. (2) The population mutation parameter (Θ = 2Neμ) can be estimated from the frequency distribution of ART-R alleles and is ∼5.69, suggesting that short term effective population size is 88 thousand to 1.2 million. This is 52-705 times greater than Ne estimated from fluctuation in allele frequencies, suggesting that we have previously underestimated the capacity for adaptive evolution in Plasmodium Our central conclusions are that retrospective studies may underestimate the complexity of selective events and the Ne relevant for adaptation for malaria is considerably higher than previously estimated.

Keywords: adaptation; drug resistance; effective population size; plasmodium; rapid evolution; soft selective sweep.


Figures

Fig. 1
Fig. 1
Evolution of ART-R on the Thailand–Myanmar border. (A) Change in clearance rate (T1/2P) between 2001 and 2014. (B) Frequency of different kelch13 mutations on the Thai–Myanmar border. Sample sizes are shown above the bars, and colors indicate the frequency of different alleles. The graph includes samples from both hyperparasitaemia (single genotype infections) and drug efficacy studies (all infections): these datasets are plotted independently in supplementary fig. S4, Supplementary Material online. (C) Selection coefficient (s) estimation for resistance alleles on the Thailand–Myanmar border. R and S are the frequency of kelch13 ART-S and ART-R alleles, and the slope (0.079) provides the estimation of s (Hartl and Dykhuizen 1981). Here, we assume a 6 generations per year. (D) Trajectory of different kelch13 alleles over time. (E) Expected heterozygosity (He) of kelch13 alleles over time.
Fig. 2
Fig. 2
Kelch13 alleles and parasite clearance phenotype A. Each circle represents T1/2P from a single patient. Sample sizes are shown for each mutation, and bars mark median values. The horizontal dotted line at T1/2P = 5 provides a cut-off for ART-R for categorizing clinical infections. Asterisks mark significant differences from WT (one-sided t-tests, *P < 0.05; **P < 0.01; ***P < 0.001; ****P < 0.0001).
Fig. 3
Fig. 3
Genetic diversity and linkage disequilibrium around resistance alleles. (A) Mean diversity (SNP-π) for SNPs flanking kelch13 on WT (black bars) and kelch13 alleles carrying mutations (white bars). (B) Mean diversity (SNP-π) surrounding individual kelch13 alleles. (Bonferroni correct P-values: *P < 0.05, **P < 0.01, ***P < 0.001). (C) Expected haplotype homozygosity (EHH) across chr. 13. Black line shows EHH surrounding WT, whereas the red lines show EHH surrounding common kelch13 alleles. The markers are unevenly spaced on chr. 13 (supplementary fig. S6, Supplementary Material online). (D) Length (kb) of extended haplotypes surrounding kelch13 alleles. Bars show the distance at which EHH decays below 0.2 on either side of kelch13.
Fig. 4
Fig. 4
Minimum spanning network of 332 kelch13 associated haplotypes. This analysis used 33 SNPs in a 472 kb region (1459805–1931812 bp) encompassing kelch13 to minimize impact of recombination and only common kelch13 alleles (represented ≥5 times in dataset) are included. Haplotypes are represented by filled circles, colored to show the associated kelch13 mutation. Circle size indicates number of samples represented (also marked). The grey lines linking circles indicate genetic relatedness: thin lines indicate ≥5 SNP differences, whereas thick lines indicate 1 SNP differences. C580Y, N458Y, and R561H associated haplotypes fall in differentiated haplotype groups consistent with ≥2 independent origins. E252Q alleles are also associated with multiple haplotypes—this ART-R mutation shows weak LD with surrounding SNPs (fig. 3) so we cannot exclude a single origin and subsequent recombination generating the pattern observed.
Fig. 5
Fig. 5
Population mutation parameter estimation. (A) Θ (=2Neµt) estimates from the number of different ART-R alleles observed in 2008. Dotted lines show the estimate (red text), and the 95% confidence errors. (B) Θ (and 95% C.I.) plotted between 2008 and 2014. Θ declines during this period. (C) Predicted evolution of kelch13 alleles on the Thai–Myanmar border based on Θ and s estimates (s = 0.079) from the current dataset. The parameter values are those listed in table 4. Time to establishment (Te) and fixation (Tfix) are estimated following (Messer and Petrov 2013). The colors indicate independent beneficial alleles and are illustrative only: the trajectories of individual alleles are not modeled here.

References

    1. Amaratunga C, Lim P, Suon S, Sreng S, Mao S, Sopha C, Sam B, Dek D, Try V, Amato R, et al. 2016. Dihydroartemisinin-piperaquine resistance in Plasmodium falciparum malaria in Cambodia: a multisite prospective cohort study. Lancet Infect Dis. 16:357–365. - PMC - PubMed
    1. Anderson T, Nkhoma S, Ecker A, Fidock D. 2011. How can we identify parasite genes that underlie antimalarial drug resistance? Pharmacogenomics 12:59–85. - PMC - PubMed
    1. Anderson TJ, Roper C. 2005. The origins and spread of antimalarial drug resistance: lessons for policy makers. Acta Trop. 94:269–280. - PubMed
    1. Ariey F, Witkowski B, Amaratunga C, Beghain J, Langlois AC, Khim N, Kim S, Duru V, Bouchier C, Ma L, et al. 2014. A molecular marker of artemisinin-resistant Plasmodium falciparum malaria. Nature 505:50–55. - PMC - PubMed
    1. Ashley EA, Dhorda M, Fairhurst RM, Amaratunga C, Lim P, Suon S, Sreng S, Anderson JM, Mao S, Sam B, et al. 2014. Spread of artemisinin resistance in Plasmodium falciparum malaria. N Engl J Med. 371:411–423. - PMC - PubMed