. 2017 Apr;36(4):983-993.
doi: 10.1109/TMI.2016.2643565. Epub 2016 Dec 21.

Passive Acoustic Mapping with the Angular Spectrum Method

Passive Acoustic Mapping with the Angular Spectrum Method

Costas D Arvanitis et al. IEEE Trans Med Imaging. 2017 Apr.

Abstract

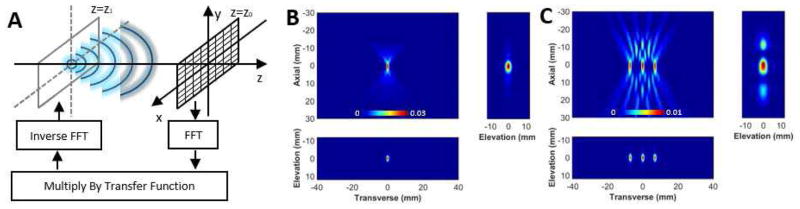
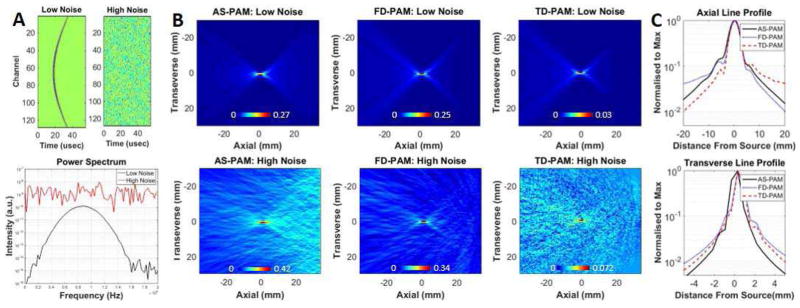
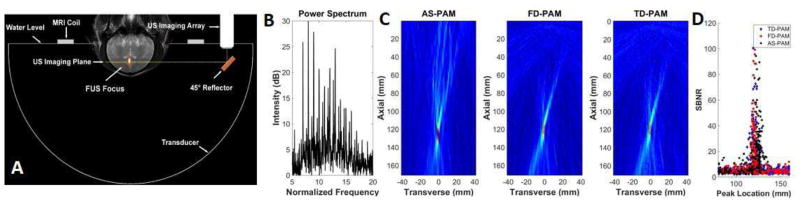
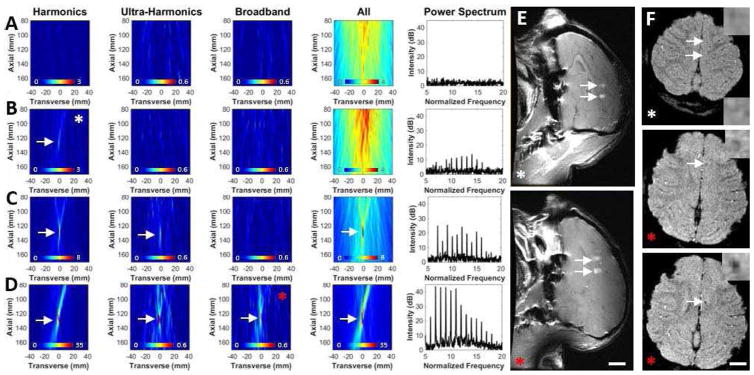
In the present proof of principle study, we evaluated the homogenous angular spectrum method for passive acoustic mapping (AS-PAM) of microbubble oscillations using simulated and experimental data. In the simulated data we assessed the ability of AS-PAM to form 3D maps of a single and multiple point sources. Then, in the two dimensional limit, we compared the 2D maps from AS-PAM with alternative frequency and time domain passive acoustic mapping (FD- and TD-PAM) approaches. Finally, we assessed the ability of AS-PAM to visualize microbubble activity in vivo with data obtained during 8 different experiments of FUS-induced blood-brain barrier disruption in 3 nonhuman primates, using a clinical MR-guided FUS system. Our in silico results demonstrate AS-PAM can be used to perform 3D passive acoustic mapping. 2D AS-PAM as compared to FD- PAM and TD-PAM is 10 and 200 times faster respectively and has similar sensitivity, resolution, and localization accuracy, even when the noise was 10-fold higher than the signal. In-vivo, the AS-PAM reconstructions of emissions at frequency bands pertinent to the different types of microbubble oscillations were also found to be more sensitive than TD-PAM. AS-PAM of harmonic-only components predicted safe blood-brain barrier disruption, whereas AS-PAM of broadband emissions correctly identified MR-evident tissue damage. The disparity (3.2 mm) in the location of the cavitation activity between the three methods was within their resolution limits. These data clearly demonstrate that AS-PAM is a sensitive and fast approach for PAM, thus providing a clinically relevant method to guide therapeutic ultrasound procedures.


Figures

Fig. 1
Fig. 1
Insilico 3D passive acoustic mapping with the angular spectrum method. A) Graphic representation of the AS-PAM. The microbubble (point source) is at z=z1, and the plane of the ultrasound imaging array is at z=z0. First, the FFT of the recorded RF-data is determined. Then, it is multiplied with the transfer function. Finally, after an inverse FFT, the location of the microbubbles can be estimated. To form 2D and 3D images, these steps are repeated for different depths (z). B) 3D AS-PAM of a single point source. C) 3D AS-PAM with three point sources separated by 4 wavelengths. The image dimensions were x=200, y=650, t=1800; dt=23nsec; f-Nyquist=22 MHz. The back-propagation for a field of view of 25×80×70 mm, with 0.125 mm pixel size, in x and y direction and 0.55 mm, in z direction, was performed in 4.5s. All color maps are linear and expressed in a.u..
Fig. 2
Fig. 2
Insilico 2D passive acoustic mapping. A) Above: Simulated RF-data with different levels of white Gaussian noise added (left low noise, right high noise). Below: Power spectra generated from RF-data of the middle element of the virtual array for the low and high noise level cases. B) AS-PAM (left), FD-PAM (middle) and TD-PAM (right) with low (top) and high (bottom) white Gaussian noise. For AS-PAM and FD-PAM, 50 single-frequency maps at 0.25–1.5 MHz were superimposed. C) Axial and transverse line profiles from the maps with the low noise for the three back-propagation methods. The reconstruction time for a field of view of 70×80 mm with 0.54×0.54 mm pixels was 0.5±0.01 s with AS-PAM; 5.9±0.5 s with FD-PAM and 38.8±0.9 s with TD-PAM (pixel size: 0.54 mm2) it was 58 s. The 2D maps are rotated by 90 degrees with respect to the 3D maps in Fig. 1. The images were set to zero by means of minimum signal subtraction. All color maps are linear and expressed in a.u..
Fig. 3
Fig. 3
Invivo 2D passive acoustic mapping. A) The experimental setup used to test AS-PAM in vivo. A coronal T2-weighted MR image has been annotated to show the location of the FUS transducer and its focal region, the ultrasound imaging array that was connected to the research imaging engine, and the MRI surface coil. The annotations were drawn to scale with the location of the head in a typical position. B) The power spectra of the microbubble acoustic emissions used to perform passive acoustic mapping. C) AS-PAM (left) with all frequency components, FD-PAM (middle) with all frequency components and TD-PAM (right). In AS-PAM we superimposed the maps from all the available frequencies (1.2 MHz- 4.2 MH). D) The location of the peak value in the axial direction for all the maps as a function of the signal-to-noise ratio (SBNR).
Fig. 4
Fig. 4
Invivo 2D frequency-selective AS-PAM for emissions with different frequency content and MRI assessment of the effects produced by the sonications in nonhuman primates. A) without microbubble acoustic emissions (control); B) with harmonic-only microbubble acoustic emissions; C) with harmonic and ultra-harmonic microbubble acoustic emissions without broadband emissions; D) with broadband microbubble acoustic emissions. The reconstruction time for all of the images needed to make these three frequency-selective maps was 0.48±0.001s. The reconstruction time for all frequencies-PAM was 1.77±0.03s. For clarity only part of the original 80×170 mm field of view is shown. Arrows indicate maps with SBNR>10. The images are perpendicular to the therapeutic beam path as shown in Figure 3A. All color maps are linear and expressed in a.u. E) BBB assessment with T1-weighted fast spin echo imaging after intravenous administration of MRI contrast agent. F) T2*-weighted spoiled gradient echo images that are sensitive to the presence of petechiae that can occur when inertial cavitation is produced. Inset is a magnification of the targeted region. The images are from two different experiments. The two targets sonicated in the top images in A and B had AS-PAM with harmonics only signal. The maps in B shows representative examples from this experiment (white asterisk). The AS-PAM acquired during sonication at the targets in the low image in E) and in the middle and lower images in F) had harmonic, ultra-harmonic and broadband signal. D shows representative maps from that experiment. BBB disruption and small hypointense spots (middle/bottom in F), indicative of petechiae, were observed in this case (red asterisk).

References

    1. Gateau J, Aubry JF, Chauvet D, Boch AL, Fink M, Tanter M. In vivo bubble nucleation probability in sheep brain tissue. Phys Med Biol. 2011 Nov;56(22):7001. - PubMed
    1. Vlaisavljevich E, Maxwell A, Warnez M, Johnsen E, Cain C, Xu Z. Histotripsy-induced cavitation cloud initiation thresholds in tissues of different mechanical properties. IEEE Trans Ultrason Ferroelectr Freq Control. 2014 Feb;61(2):341–352. - PMC - PubMed
    1. Rodríguez-Rodríguez J, Sevilla A, Martínez-Bazán C, Gordillo JM. Generation of Microbubbles with Applications to Industry and Medicine. Annu Rev Fluid Mech. 2015;47(1):405–429.
    1. Marmottant P, van der Meer S, Emmer M, Versluis M, de Jong N, Hilgenfeldt S, Lohse D. A model for large amplitude oscillations of coated bubbles accounting for buckling and rupture. J Acoust Soc Am. 2005 Dec;118(6):3499–3505.
    1. Shpak O, Verweij M, Vos HJ, de Jong N, Lohse D, Versluis M. Acoustic droplet vaporization is initiated by superharmonic focusing. Proc Natl Acad Sci. 2014 Feb;111(5):1697–1702. - PMC - PubMed