. 2016 Dec 27;12(12):e1006506.
doi: 10.1371/journal.pgen.1006506. eCollection 2016 Dec.

Somatic Mutation Patterns in Hemizygous Genomic Regions Unveil Purifying Selection during Tumor Evolution

Affiliations

Somatic Mutation Patterns in Hemizygous Genomic Regions Unveil Purifying Selection during Tumor Evolution

Jimmy Van den Eynden et al. PLoS Genet. .

Abstract

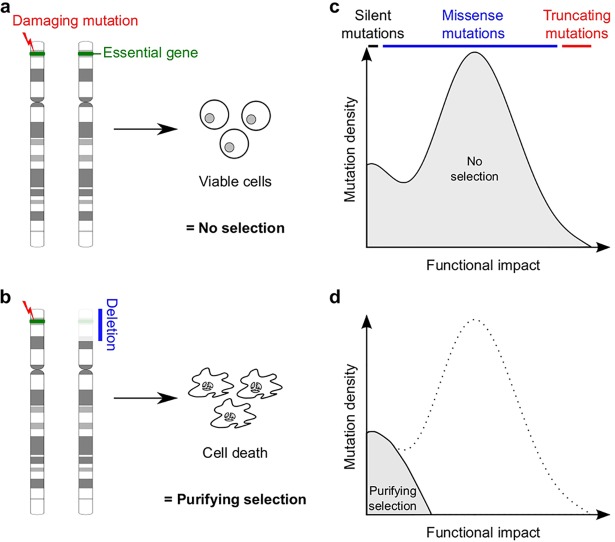
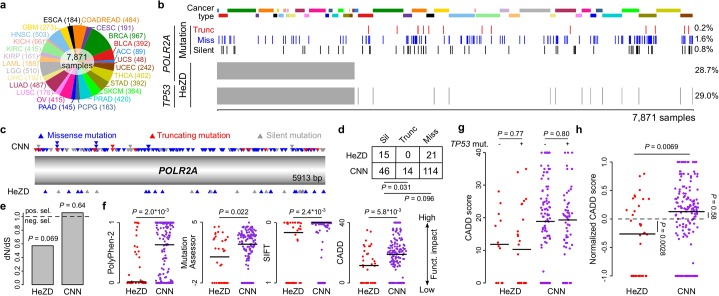
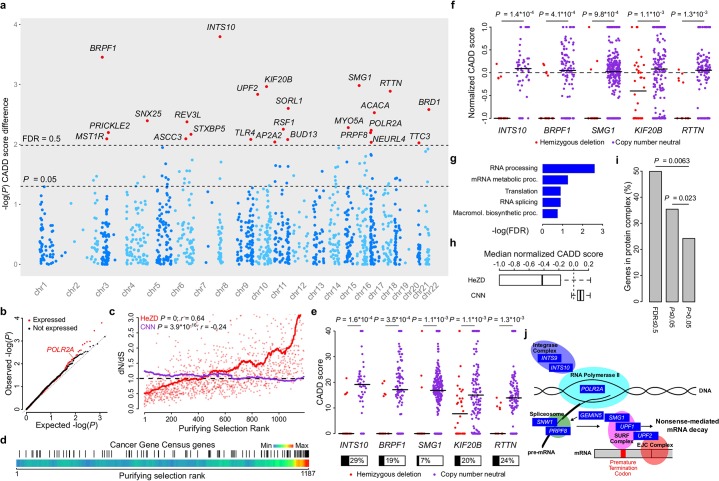
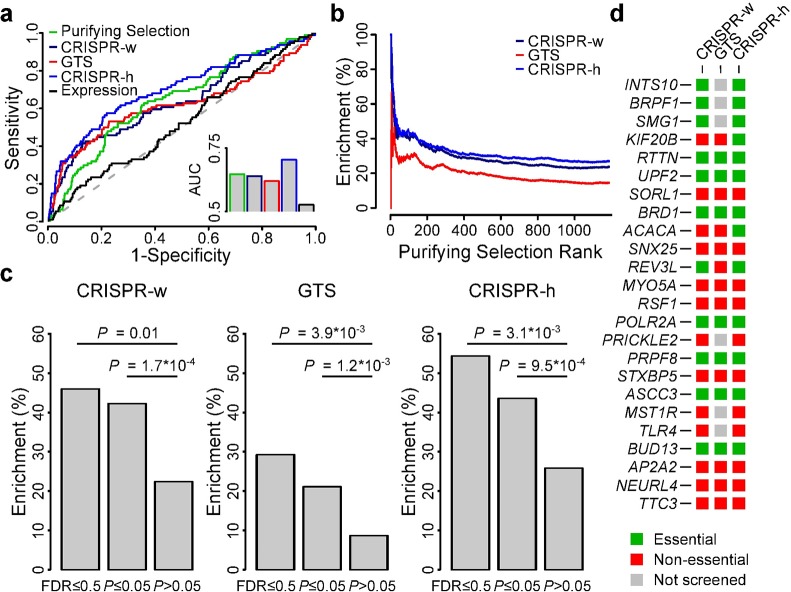
Identification of cancer driver genes using somatic mutation patterns indicative of positive selection has become a major goal in cancer genomics. However, cancer cells additionally depend on a large number of genes involved in basic cellular processes. While such genes should in theory be subject to strong purifying (negative) selection against damaging somatic mutations, these patterns have been elusive and purifying selection remains inadequately explored in cancer. Here, we hypothesized that purifying selection should be evident in hemizygous genomic regions, where damaging mutations cannot be compensated for by healthy alleles. Using a 7,781-sample pan-cancer dataset, we first confirmed this in POLR2A, an essential gene where hemizygous deletions are known to confer elevated sensitivity to pharmacological suppression. We next used this principle to identify several genes and pathways that show patterns indicative of purifying selection to avoid deleterious mutations. These include the POLR2A interacting protein INTS10 as well as genes involved in mRNA splicing, nonsense-mediated mRNA decay and other RNA processing pathways. Many of these genes belong to large protein complexes, and strong overlaps were observed with recent functional screens for gene essentiality in human cells. Our analysis supports that purifying selection acts to preserve the remaining function of many hemizygously deleted essential genes in tumors, indicating vulnerabilities that might be exploited by future therapeutic strategies.


Conflict of interest statement

The authors have declared that no competing interests exist.

Figures

Fig 1
Fig 1. Theoretical concept.
(a-b) Damaging somatic mutations in HeZD but not CNN (haplosufficient) essential genes are expected to alter cell viability and to be selected against. (c-d) This purifying selection will not affect silent and low impact missense mutations, leading to a shift in the overall functional impact when comparing CNN to HeZD tumors.
Fig 2
Fig 2. Detection of purifying selection in POLR2A in a pan-cancer dataset.
(a) Twenty-five different tumor types were pooled for analysis. (b) Overview of somatic mutations and HeZD in POLR2A. HeZD are indicated by grey vertical bars. Silent, missense and truncating mutations are indicated by black, blue and red bars respectively. Frequencies of different events are given on the right of the plot. Cancer types are indicated by color bars on top of the figure. Color legends as in panel a. (c-e) CDS positions (c), number (d) and dN/dS values (e) of mutations observed in POLR2A. (f) The functional impact of all mutations in POLR2A is predicted using different functional impact scores as indicated by ordinate labels. (g) CADD scores for POLR2A mutations in the absence (-) and presence (+) of concomitant TP53 mutations. (h) Normalized CADD scores for POLR2A mutations (see Methods and S2 Fig for details). Horizontal lines on plots indicate median values.
Fig 3
Fig 3. A genome-wide screen unveils patterns indicative of purifying selection.
A genome-wide screen was performed on 1,187 genes to detect genes subjected to purifying selection against deleterious somatic mutations. (a) Manhattan plot shows all genes that were selected for analysis. Genes at 50% FDR are indicated by red dots and labelled. (b) qq-plot shows the difference between expressed genes (as used in the analysis) and non-expressed genes. (c) Correlation between the purifying selection rank and dN/dS. Solid lines represent moving averages. For visualization purposes, individual dots of CNN dN/dS values are not shown. Spearman correlation coefficients are shown on top. (d) CGC genes are indicated by black vertical bars and shown as a function of purifying selection rank. Color bars indicate the CGC gene density. (e-f) Copy number-related CADD scores (e) and normalized CADD scores (f) from the observed mutations in the top-5 ranked genes. Proportions of samples harboring the deletion are indicated below each plot in panel e. (g) Top ranked GO biological processes gene set enrichment results. (h) Median normalized CADD scores in HeZD compared to CNN samples for the top 76 genes from the purifying selection screen. (i) Bar plot shows the proportion of genes with (at 50% FDR or P≤0.05) or without (P>0.05) signals of purifying selection that are active in protein complexes. (j) A high number of genes with signals of purifying selection is involved in RNA-related events and complexes. Horizontal lines on plots indicate median values.
Fig 4
Fig 4. Genes subject to purifying selection are identified by orthogonal methods in cell lines.
Comparison of genes showing signals of purifying selection with essential genes identified by CRISPR/Cas9 and gene-trap based methods in cell lines. (a) Receiver Operating Characteristic (ROC) curves using S. Cerevisiae essential gene homologs as a benchmark dataset. Area under the curve (AUC) values are compared in the inset. (b) Enrichment results. Curves show the cumulative proportion of experimentally-derived essential genes in cell lines as a function of purifying selection-based gene rank. (c) Bar plots show the proportion of genes identified to be under purifying selection (at 50% FDR or P≤0.05) that were retrieved by orthogonal methods. (d) Overview of the 24 genes identified at 50% FDR in this study and their identification by orthogonal methods.
Fig 5
Fig 5. Deletion and promoter hypermethylation events in genes subject to purifying selection.
Boxplots show for both sets of genes with signals of purifying selection (at 50% FDR and P≤0.05) and the other screened genes (P>0.05) the proportion of samples containing homozygous deletions (a), hemizygous deletions (b), transcription start site (TSS) hypermethylations (c) and gene CDS hypermethylations (d).

References

    1. Watson IR, Takahashi K, Futreal PA, Chin L. Emerging patterns of somatic mutations in cancer. Nat Rev Genet. 2013;14: 703–18. 10.1038/nrg3539 - DOI - PMC - PubMed
    1. Vogelstein B, Papadopoulos N, Velculescu VE, Zhou S, Diaz LA, Kinzler KW. Cancer genome landscapes. Science. 2013;339: 1546–58. 10.1126/science.1235122 - DOI - PMC - PubMed
    1. Liu Y, Zhang X, Han C, Wan G, Huang X, Ivan C, et al. TP53 loss creates therapeutic vulnerability in colorectal cancer. Nature. 2015;520: 697–701. 10.1038/nature14418 - DOI - PMC - PubMed
    1. Muller FL, Colla S, Aquilanti E, Manzo VE, Genovese G, Lee J, et al. Passenger deletions generate therapeutic vulnerabilities in cancer. Nature. 2012;488: 337–342. 10.1038/nature11331 - DOI - PMC - PubMed
    1. Abecasis GR, Auton A, Brooks LD, DePristo MA, Durbin RM, Handsaker RE, et al. An integrated map of genetic variation from 1,092 human genomes. Nature. 2012;491: 56–65. 10.1038/nature11632 - DOI - PMC - PubMed

LinkOut - more resources