. 2016 Dec 27;12(12):e1006510.
doi: 10.1371/journal.pgen.1006510. eCollection 2016 Dec.

Elevated Fibroblast Growth Factor Signaling Is Critical for the Pathogenesis of the Dwarfism in Evc2/Limbin Mutant Mice

Affiliations

Elevated Fibroblast Growth Factor Signaling Is Critical for the Pathogenesis of the Dwarfism in Evc2/Limbin Mutant Mice

Honghao Zhang et al. PLoS Genet. .

Abstract

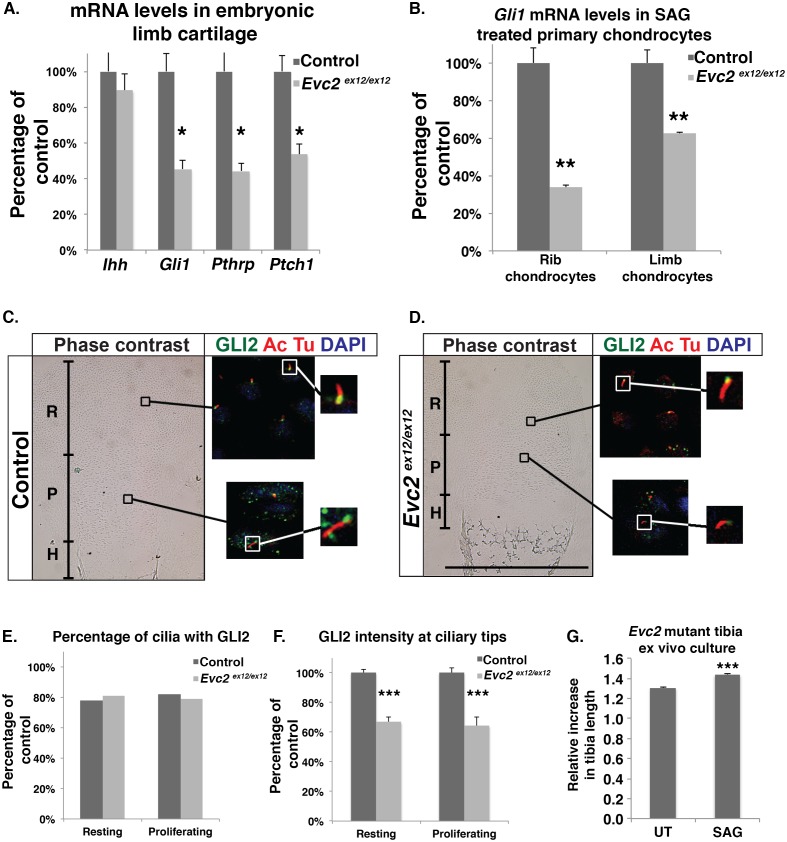
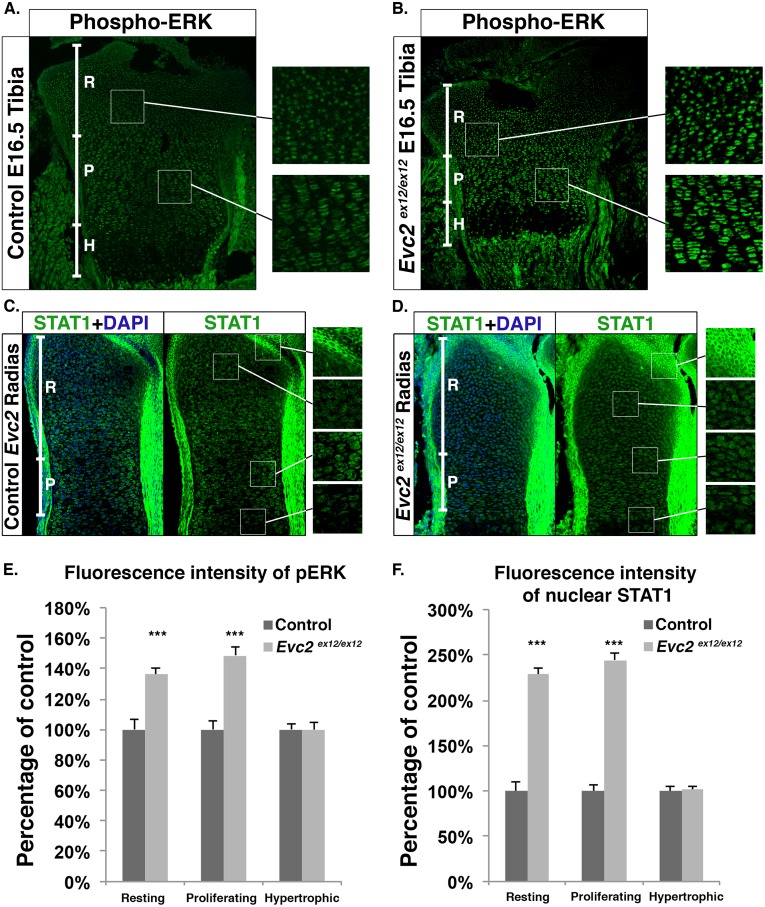
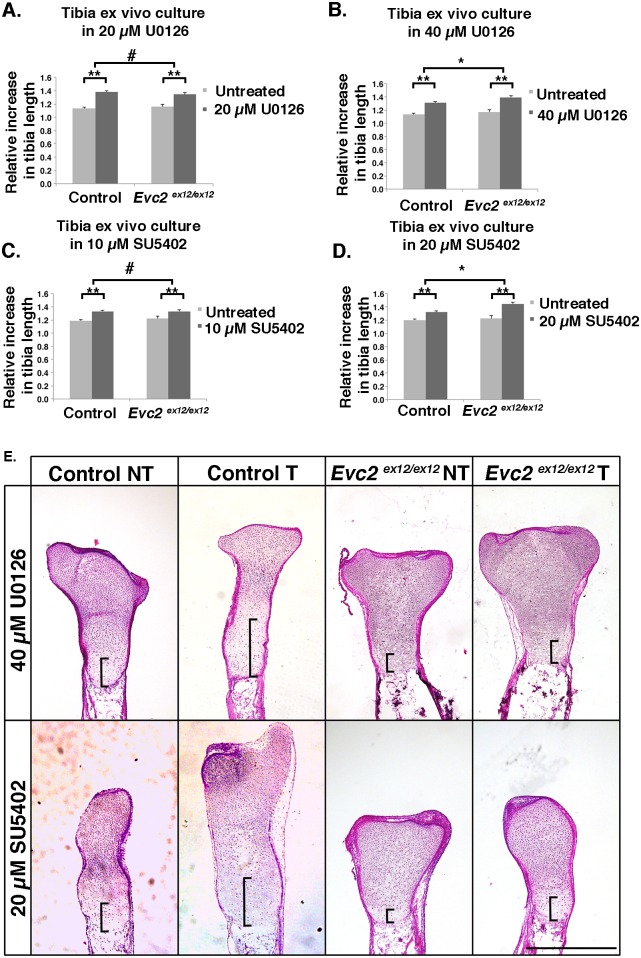
Ellis-van Creveld (EvC) syndrome is a skeletal dysplasia, characterized by short limbs, postaxial polydactyly, and dental abnormalities. EvC syndrome is also categorized as a ciliopathy because of ciliary localization of proteins encoded by the two causative genes, EVC and EVC2 (aka LIMBIN). While recent studies demonstrated important roles for EVC/EVC2 in Hedgehog signaling, there is still little known about the pathophysiological mechanisms underlying the skeletal dysplasia features of EvC patients, and in particular why limb development is affected, but not other aspects of organogenesis that also require Hedgehog signaling. In this report, we comprehensively analyze limb skeletogenesis in Evc2 mutant mice and in cell and tissue cultures derived from these mice. Both in vivo and in vitro data demonstrate elevated Fibroblast Growth Factor (FGF) signaling in Evc2 mutant growth plates, in addition to compromised but not abrogated Hedgehog-PTHrP feedback loop. Elevation of FGF signaling, mainly due to increased Fgf18 expression upon inactivation of Evc2 in the perichondrium, critically contributes to the pathogenesis of limb dwarfism. The limb dwarfism phenotype is partially rescued by inactivation of one allele of Fgf18 in the Evc2 mutant mice. Taken together, our data uncover a novel pathogenic mechanism to understand limb dwarfism in patients with Ellis-van Creveld syndrome.


Conflict of interest statement

The authors have declared that no competing interests exist.

Figures

Fig 1
Fig 1. A homozygous inactivating mutation in Evc2 leads to defective limb growth.
H and E staining of humerus proximal growth plates from control and Evc2 mutant embryos at E18.5 (A), E16.5 (B), E14.5 (C) and cartilage primordia at E12.5 (D). The black double arrows indicate the length of the proximal growth plates (A-C), and the entire cartilage primordia (D). At E14.5, since a bone tissue has not separated the presumptive proximal growth plate and the presumptive distal growth plate, we take measurements from the top of the cartilage primordia to the center of the hypertrophic chondrocyte area (C) as lengths of the proximal growth plates. The grey double arrows indicate the length of the proliferating chondrocyte zone (A, B). The brackets indicate the hypertrophic chondrocyte zone of the proximal growth plate (A, B) and the area of hypertrophic chondrocytes at the middle of the cartilage primordia (C). Quantifications of the growth plate lengths (E), hypertrophic chondrocyte zone lengths (F), hypertrophic chondrocyte cell numbers (G) and proliferating chondrocyte zone lengths (H) at the indicated stages are shown. The percentages of the control are shown in each chart. Immunohistochemistry of SOX9 of humerus at E12.5 (I) indicates the condensed mesenchyme in humerus. Quantifications of the length of SOX9 positive areas (J) are shown. (Error bars indicate standard errors. (n = 6, ** p<0.01). Scale bars: 200 μm for (A), (B), (C) and (D).
Fig 2
Fig 2. Compromised but not abrogated Hedgehog signaling is detected in Evc2 mutant mice.
A. Q-RT-PCR quantification of mRNA levels for the indicated genes in tibial cartilage from E16.5 embryos (n = 6, * p<0.05). B. Fold changes in Hedgehog signaling in primary chondrocytes isolated from E18.5 ribs and knee joints. Cell cycle was arrested before treatment with 100 nM SAG. Fold changes of Gli1 mRNA levels due to treatment are presented relative to control levels before treatment (n = 3, **p<0.01). C-D. E16.5 humerus growth plates from control embryos (C) and Evc2 mutant littermates (D) were stained for acetylated tubulin (ciliary marker, red), GLI2 (green) and DNA (blue). R: Resting chondrocyte, P: Proliferating chondrocyte, H: Hypertrophic chondrocyte. E. Quantification of the percentage of cilia positive for GLI2 staining at the tip in control and mutant samples shown in panel C and D (n = 80). F. Quantification of the intensity of GLI2 staining at ciliary tips in control and mutant samples (n = 40, p<0.001). G. Tibia ex vivo culture indicated that Evc2 mutants responded to SAG treatment. Tibiae were dissected out from E16.5 Evc2 mutant hindlimbs and cultured with or without 1 μM SAG for 7 days. Growth rates were calculated using the tibia length at D7 compared to D0 (n = 5, *** p<0.001). UT, untreated. Scale bars: 200 μm for (C) and (D).
Fig 3
Fig 3. Increased FGF signaling is detected in Evc2 mutant growth plates.
A-B. Immunohistochemistry for phospho-ERK in tibia proximal growth plates from E16.5 control (A) and mutant (B) littermates. C-D. Immunohistochemistry of nuclear STAT1 in radius growth plates of E16.5 control (D) and mutant littermates (E). In all four panels, enlarged areas of distinct growth plate zones are shown on the right. E-F. Quantification of phospho-ERK (E) and nuclear STAT1 (F) signal intensities. Data are presented as percentages of controls (n = 80, ***p<0.001). R: Resting chondrocytes, P: Proliferating chondrocytes, H: Hypertrophic chondrocytes.
Fig 4
Fig 4. Growth plates in Evc2 mutants have elevated FGF signaling.
A. qRT-PCR assay of Spry2, Spry3 and Spry4 mRNA levels in growth plate cartilage from E16.5 Evc2 mutant and control littermates (n = 6, *p<0.05). B. qRT-PCR assay of p21 mRNA levels in the same samples as in panel A. C. qRT-PCR assay of Fgfr1, Fgfr2 and Fgfr3 mRNA levels in the same samples as in panel A. D. In situ hybridization indicates elevated Fgf18 RNA levels in the perichondrium of tibiae from E18.5 Evc2 mutants. Arrows indicate the perichondrium in both controls and mutants. E. Immunohistochemistry of GFP in the proximal tibie in Evc2WT; Fgf18GFP:CreEr and Evc2 ex12/ex12; Fgf18GFP:CreEr indicates an elevated Fgf18 expression in Evc2 mutants. F. qRT-PCR assay of Fgf18 mRNA levels in the perichondrium of E16.5 control and Evc2 mutant tibiae (n = 4, p<0.01). Scale bars: 200 μm for (D).
Fig 5
Fig 5. Tibia ex vivo culture indicates elevated endogenous FGF signaling in Evc2 mutant growth plates.
E16.5 control or Evc2 mutant tibiae were cultured with 20 μM (A) or 40 μM (B) U0126, or with 10 μM (C) or 20 μM (D) SU5402 for 7 days. Growth rates were calculated as the tibia length at D7 relative to D0 (n = 6, * p<0.05, ** p<0.01, # p>0.2). (E) H&E staining of tibiae after ex vivo culture. (NT, no treatment; T, treatment). Pictures show the proximal half of tibiae, with brackets pointing to drastic differences in the height of the hypertrophic chondrocyte zone among samples. Scale bars: 200 μm for (E).
Fig 6
Fig 6. Elevated FGF signaling plays critical role in the pathogenesis of dwarfism in Evc2 mutants.
A. H&E staining of tibia proximal growth plates from E18.5 Evc2 mutants and littermate controls. B. Quantification of growth plate zone lengths from similar samples as in panel A (n = 6, * p<0.01). C. H&E staining of tibia proximal growth plates from E18.5 embryos with ATC-mediated Evc2 deletion and from littermate controls. D. Quantification of growth plate zone lengths from similar samples as in panel C (n = 6, * p<0.01). E. H&E staining of tibia proximal growth plates from E18.5 embryos with Dermo1Cre-mediated Evc2 deletion and from littermate controls. F. Quantification of growth plate zone lengths from similar samples as in panel E (n = 6, * p<0.01). G-P. qRT-PCR assays of mRNA levels of indicated genes. Total RNA was isolated from the growth plates of (G-K) embryos with ATC-mediated Evc2 deletion (Evc2 fx/fx; ATC, grey bar) and littermate controls (Evc2 fx/+; ATC, black bar), and (L-P) embryos with Dermo1Cre-mediated Evc2 deletion (Evc2 fx/fx; Dermo1Cre, grey bar) and littermate controls (Evc2 fx/+; Dermo1Cre, black bar) (n = 5, *p<0.05, ** p<0.01). J. Expression levels of Fgf18 were evaluated by qRT-PCR using RNA isolated from the perichondrium in ATC mediated Evc2 mutant and littermate control (n = 5). Expression levels of Gli1 (K), Fgfr3 (L) and Spry3 (M) were evaluated by qRT-PCR using RNA isolated from the growth plate cartilage in Dermo1Cre mediated Evc2 mutant and littermate control (n = 5, *p<0.05, ** p<0.01). O. Expression levels of Fgf18 were evaluated by qRT-PCR using RNA isolated from the perichondrium in Dermo1Cre mediated Evc2 mutant and littermate control (n = 5, ** p<0.01). Scale bars: 200 μm for (A), (C) and (E).
Fig 7
Fig 7. Dwarfism in Evc2 mutant mice is partially rescued by loss of one copy of Fgf18.
A. H&E staining of tibia proximal growth plates from E18.5 Evc2 ex12/ex12mutants, Evc2 ex12/ex12mutants that are heterozygous for Fgf18 (Evc2 ex12/ex12; Fgf18 lacZ/+) and littermate controls. B. Quantification of growth plate zone lengths from similar samples as in panel A (n = 6, ** comparing to Evc2 control, p<0.01; &, comparing to Evc2 ex12/ex12; Fgf18 LacZ/+, p<0.05; &&, comparing to Evc2 ex12/ex12; Fgf18 LacZ/+, p<0.01).

References

    1. McKusick VA, Egeland JA, Eldridge R, Krusen DE. Dwarfism in the Amish I. The Ellis-Van Creveld Syndrome. Bull Johns Hopkins Hosp. 1964;115:306–36. Epub 1964/10/01. - PubMed
    1. Ruiz-Perez VL, Ide SE, Strom TM, Lorenz B, Wilson D, Woods K, et al. Mutations in a new gene in Ellis-van Creveld syndrome and Weyers acrodental dysostosis. Nat Genet. 2000;24(3):283–6. Epub 2000/03/04. 10.1038/73508 - DOI - PubMed
    1. Ruiz-Perez VL, Tompson SW, Blair HJ, Espinoza-Valdez C, Lapunzina P, Silva EO, et al. Mutations in two nonhomologous genes in a head-to-head configuration cause Ellis-van Creveld syndrome. Am J Hum Genet. 2003;72(3):728–32. Epub 2003/02/07. - PMC - PubMed
    1. Takeda H, Takami M, Oguni T, Tsuji T, Yoneda K, Sato H, et al. Positional cloning of the gene LIMBIN responsible for bovine chondrodysplastic dwarfism. Proc Natl Acad Sci U S A. 2002;99(16):10549–54. Epub 2002/07/24. 10.1073/pnas.152337899 - DOI - PMC - PubMed
    1. Murgiano L, Jagannathan V, Benazzi C, Bolcato M, Brunetti B, Muscatello LV, et al. Deletion in the EVC2 gene causes chondrodysplastic dwarfism in Tyrolean Grey cattle. PLoS One. 2014;9(4):e94861 Epub 2014/04/16. 10.1371/journal.pone.0094861 - DOI - PMC - PubMed

MeSH terms