Spending on Children's Personal Health Care in the United States, 1996-2013
- PMID: 28027344
- PMCID: PMC5546095
- DOI: 10.1001/jamapediatrics.2016.4086
Spending on Children's Personal Health Care in the United States, 1996-2013
Abstract
Importance: Health care spending on children in the United States continues to rise, yet little is known about how this spending varies by condition, age and sex group, and type of care, nor how these patterns have changed over time.
Objective: To provide health care spending estimates for children and adolescents 19 years and younger in the United States from 1996 through 2013, disaggregated by condition, age and sex group, and type of care.
Evidence review: Health care spending estimates were extracted from the Institute for Health Metrics and Evaluation Disease Expenditure 2013 project database. This project, based on 183 sources of data and 2.9 billion patient records, disaggregated health care spending in the United States by condition, age and sex group, and type of care. Annual estimates were produced for each year from 1996 through 2013. Estimates were adjusted for the presence of comorbidities and are reported using inflation-adjusted 2015 US dollars.
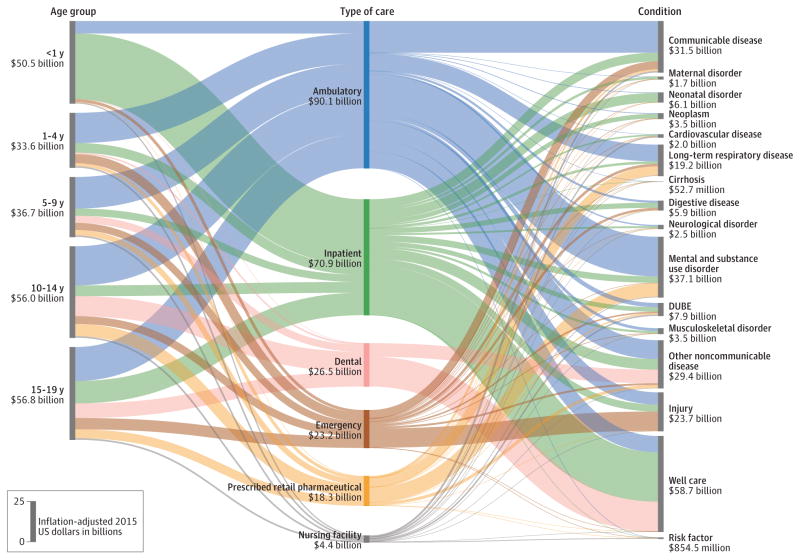
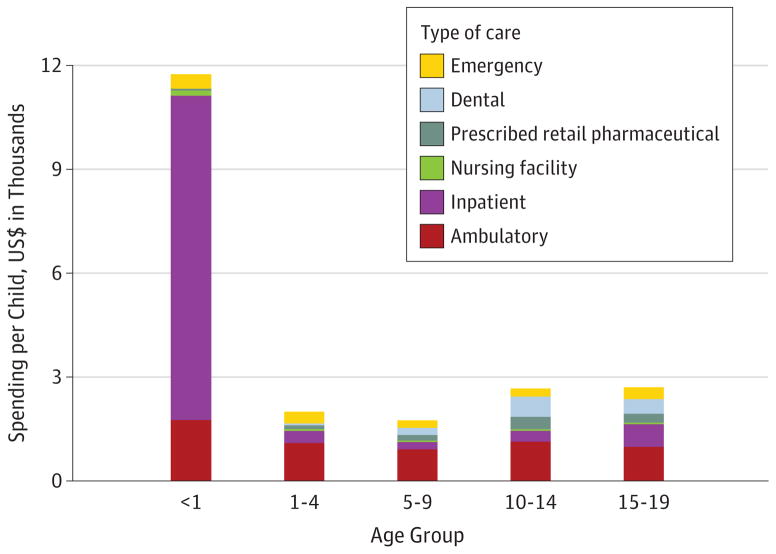
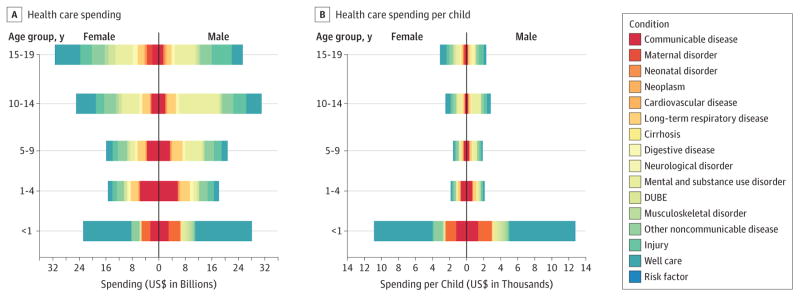
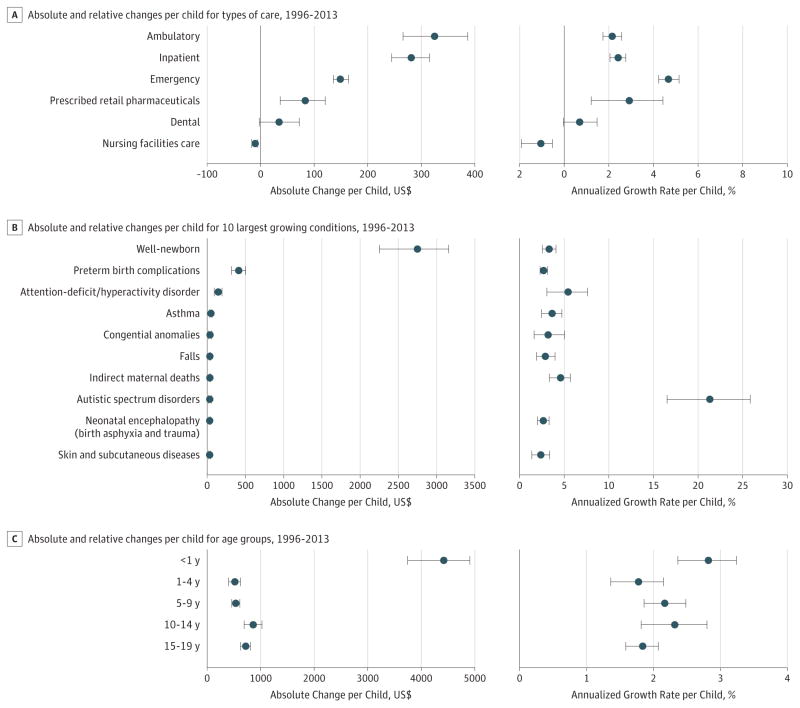
Findings: From 1996 to 2013, health care spending on children increased from $149.6 (uncertainty interval [UI], 144.1-155.5) billion to $233.5 (UI, 226.9-239.8) billion. In 2013, the largest health condition leading to health care spending for children was well-newborn care in the inpatient setting. Attention-deficit/hyperactivity disorder and well-dental care (including dental check-ups and orthodontia) were the second and third largest conditions, respectively. Spending per child was greatest for infants younger than 1 year, at $11 741 (UI, 10 799-12 765) in 2013. Across time, health care spending per child increased from $1915 (UI, 1845-1991) in 1996 to $2777 (UI, 2698-2851) in 2013. The greatest areas of growth in spending in absolute terms were ambulatory care among all types of care and inpatient well-newborn care, attention-deficit/hyperactivity disorder, and asthma among all conditions.
Conclusions and relevance: These findings provide health policy makers and health care professionals with evidence to help guide future spending. Some conditions, such as attention-deficit/hyperactivity disorder and inpatient well-newborn care, had larger health care spending growth rates than other conditions.
Conflict of interest statement
Figures
Comment in
-
Spending on Children's Health Care in the United States: Accomplishments and Challenges in Financing Health Services for Children.JAMA Pediatr. 2017 Feb 1;171(2):110-111. doi: 10.1001/jamapediatrics.2016.4084. JAMA Pediatr. 2017. PMID: 28027330 No abstract available.
References
-
- Hartman M, Martin AB, Lassman D, Catlin A National Health Expenditure Accounts Team. National health spending in 2013: growth slows, remains in step with the overall economy. Health Aff (Millwood) 2015;34(1):150–160. - PubMed
-
- United States Census Bureau. [Accessed June 4, 2015];Age and sex composition in the United States. http://www.census.gov/population/age/data/2012comp.html.
-
- Health Care Cost Institute. [Accessed July 26, 2016];Children’s health spending: 2010–2014. http://www.healthcostinstitute.org/files/2016%20Kids%20Report%205.16.16.pdf.
-
- Lassman D, Hartman M, Washington B, Andrews K, Catlin A. US health spending trends by age and gender: selected years 2002–10. Health Aff (Millwood) 2014;33(5):815–822. - PubMed
-
- Simpson L, Zodet MW, Chevarley FM, Owens PL, Dougherty D, McCormick M. Health care for children and youth in the United States: 2002 report on trends in access, utilization, quality, and expenditures. Ambul Pediatr. 2004;4(2):131–153. - PubMed