. 2017 Feb:58:139-151.
doi: 10.1016/j.alcohol.2016.08.008. Epub 2016 Dec 16.

Analyses of differentially expressed genes after exposure to acute stress, acute ethanol, or a combination of both in mice

Affiliations

Analyses of differentially expressed genes after exposure to acute stress, acute ethanol, or a combination of both in mice

Jessica A Baker et al. Alcohol. 2017 Feb.

Abstract

Alcohol abuse is a complex disorder, which is confounded by other factors, including stress. In the present study, we examined gene expression in the hippocampus of BXD recombinant inbred mice after exposure to ethanol (NOE), stress (RSS), and the combination of both (RSE). Mice were given an intraperitoneal (i.p.) injection of 1.8 g/kg ethanol or saline, and subsets of both groups were exposed to acute restraint stress for 15 min or controls. Gene expression in the hippocampus was examined using microarray analysis. Genes that were significantly (p < 0.05, q < 0.1) differentially expressed were further evaluated. Bioinformatic analyses were predominantly performed using tools available at GeneNetwork.org, and included gene ontology, presence of cis-regulation or polymorphisms, phenotype correlations, and principal component analyses. Comparisons of differential gene expression between groups showed little overlap. Gene Ontology demonstrated distinct biological processes in each group with the combined exposure (RSE) being unique from either the ethanol (NOE) or stress (RSS) group, suggesting that the interaction between these variables is mediated through diverse molecular pathways. This supports the hypothesis that exposure to stress alters ethanol-induced gene expression changes and that exposure to alcohol alters stress-induced gene expression changes. Behavior was profiled in all groups following treatment, and many of the differentially expressed genes are correlated with behavioral variation within experimental groups. Interestingly, in each group several genes were correlated with the same phenotype, suggesting that these genes are the potential origins of significant genetic networks. The distinct sets of differentially expressed genes within each group provide the basis for identifying molecular networks that may aid in understanding the complex interactions between stress and ethanol, and potentially provide relevant therapeutic targets. Using Ptp4a1, a candidate gene underlying the quantitative trait locus for several of these phenotypes, and network analyses, we show that a large group of differentially expressed genes in the NOE group are highly interrelated, some of which have previously been linked to alcohol addiction or alcohol-related phenotypes.

Keywords: Bioinformatic analysis; Ethanol; Gene expression; Hippocampus; Stress.


Figures

Fig. 1
Fig. 1. Distinct genes were differentially expressed among the three treatment groups
Venn diagram of overlapping significantly differentially expressed genes with criteria as follows: p value < 0.05, q value < 0.1.
Fig. 2
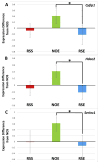
Fig. 2. Examples of differentially expressed genes where ethanol exposure increases gene expression and combined exposure to ethanol and stress decreases expression, similar to stress alone
The graphs show mean (±SEM) differences in expression after treatment from the control, NOS, group with increased expression above the zero line and decreased expression below the zero line. In each graph, red (left) bars show difference in expression after stress alone (RSS), green (middle) bars show difference in expression after ethanol alone (NOE), and blue (right) bars show difference in expression after combined stress and ethanol (RSE). A) Differential expression of Cyfip1 (Probe ID: ILM5690082), difference from NOS group: RSS (M = −0.08, SEM = 0.23), NOE (M = 0.41, SEM = 0.27), RSE (M = −0.22, SEM = 0.33). B) Differential expression of Hdac2 (Probe ID: ILM4050433), difference from NOS group: RSS (M = −0.09, SEM = 0.21), NOE (M = 0.42, SEM = 0.19), RSE (M = −0.21, SEM = 0.21). C) Differential expression of Serinc1 (Probe ID: ILM6650020), difference from NOS group: RSS (M = −0.01, SEM = 0.38), NOE (M = 0.62, SEM = 0.27), RSE (M = −0.14, SEM = 0.36). An * represents a significance difference at p < 0.05 and q < 0.1 and shows the significant difference between the NOE and RSE groups. (For interpretation of the references to colour in this figure legend, the reader is referred to the web version of this article.)
Fig. 3
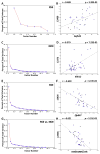
Fig. 3. The relationship among differentially expressed genes correlated with the same phenotypes and examples of significant correlations between a differentially expressed gene and its correlated phenotype
A) Principal component analysis (PCA) examining the relationship among five genes correlated with activity in the closed quadrants of the elevated zero maze for the RSS group. B) Correlation scatterplot between Defb22 (Probe ID: ILM101050408) from the RSS group and activity in closed quadrants of an elevated zero maze, defined as number of beam breaks per second, after restraint stress for 15 min during the first 5 min for females (Trait ID: 12460) (r = 0.489, p = 3.39E-03). C) PCA examining the relationship among 29 genes correlated with activity in the closed quadrants of the elevated zero maze for the NOE group. D) Correlation scatterplot between Klhl12 (Probe ID: ILM6040520) from the NOE group and activity in closed quadrants of an elevated zero maze, defined as number of beam breaks per second, after ethanol injection of 1.8 g/kg during last 5 min in females (Trait ID: 12373) (r = 0.579, p = 7.23E-05). E) PCA examining the relationship among 29 genes correlated with time in the open quadrants of the elevated zero maze for the RSE group. F) Correlation scatterplot between Zfp867 (Probe ID: ILM4610341) and percent time spent in open quadrants of the elevated zero maze after restraint stress for 15 min and an ethanol injection of 1.8 g/kg during the first 5 min in females (Trait ID: 12426) (r = −0.630, p = 3.72E–05). G) PCA examining the relationship among 27 genes correlated with time in open quadrants of the elevated zero maze for the RSE vs. NOE group. H) Correlation scatterplot between 9330168M11Rik (Probe ID: ILM106110280) from the RSE vs. NOE group and percent time spent in open quadrants of the elevated zero maze after restraint stress of 15 min and an ethanol injection of 1.8 g/kg during the 10 min for females (Trait ID: 12428) (r = −0.621, p = 5.31E–05).
Fig. 4
Fig. 4. Multiple stress- and/or alcohol-related phenotypes that are significantly correlated with differentially expressed genes from the RSS, NOE, RSE, and RSE vs. NOE groups have significant QTLs on chromosome 1 between 20–40 Mb
11699 (fifth, red line) phenotype: locomotor activity after ethanol injection of 2.25 g/kg in 10-min sessions for females. 12390 (second, orange line) phenotype: activity in closed quadrants of an elevated zero maze after ethanol injection of 1.8 g/kg during last 5 min for males and females. 12449 (top, light-green line) phenotype: activity in closed quadrants of an elevated zero maze after restraint stress for 15 min and an ethanol injection of 1.8 g/kg during the first 5 min for males and females. 12635 (third, light-blue line) phenotype: number of rears in the light side of a light-dark box in 5-min sessions with an ethanol injection of 1.8 g/kg for males (exact same line as dark blue line). 10970 (third, dark blue line) phenotype: rearing events in the light side of a light-dark box in 5 min sessions with an ethanol injection of 1.8 g/kg for males. (For interpretation of the references to colour in this figure legend, the reader is referred to the web version of this article.)
Fig. 5
Fig. 5. Ptp4a1 (protein tyrosine phosphatase 4a1) genetic pathway showing the relationship among its correlated genes that are differentially expressed after exposure to ethanol
Twenty-three differentially expressed genes are significantly correlated with Ptp4a1 and each other. Each box contains the gene symbol, probe ID, and Pearson’s correlation p value. Bold red lines denote Pearson’s correlations coefficients of 0.7–1. Solid orange lines denote Pearson’s correlations coefficients of 0.5–0.7. Dashed pink lines denote Pearson’s correlations coefficients of 0–0.5. Dashed black lines denote Pearson’s correlations coefficients of −0.5 to 0. Solid green lines denote Pearson’s correlations coefficients of −0.7 to −0.5. Solid blue lines denote Pearson’s correlations coefficients of −1.0 to −0.7. (For interpretation of the references to colour in this figure legend, the reader is referred to the web version of this article.)

References

    1. Alfonso J, Frasch AC, Flugge G. Chronic stress, depression and anti-depressants: Effects on gene transcription in the hippocampus. Reviews in the Neurosciences. 2005;16:43–56. - PubMed
    1. Anthenelli R, Grandison L. Effects of stress on alcohol consumption. Alcohol Research. 2012;34:381–382. - PMC - PubMed
    1. Aujla H, Cannarsa R, Romualdi P, Ciccocioppo R, Martin-Fardon R, Weiss F. Modification of anxiety-like behaviors by nociception/orphanin FQ (N/ OFQ) and time-dependent changes in N/OFQ-NOP gene expression following ethanol withdrawal. Addiction Biology. 2013;18:467–479. - PMC - PubMed
    1. Becker HC, Lopez MF. Increased ethanol drinking after repeated chronic ethanol exposure and withdrawal experience in C57BL/6 mice. Alcoholism: Clinical and Experimental Research. 2004;28:1829–1838. - PubMed
    1. Becker HC, Lopez MF, Doremus-Fitzwater TL. Effects of stress on alcohol drinking: A review of animal studies. Psychopharmacology (Berl) 2011;218:131–156. - PMC - PubMed

MeSH terms