

Convergence in leaf size versus twig leaf area scaling: do plants optimize leaf area partitioning?
- PMID: 28028019
- PMCID: PMC7296615
- DOI: 10.1093/aob/mcw231
Convergence in leaf size versus twig leaf area scaling: do plants optimize leaf area partitioning?
Abstract
Background and aims: Corner's rule states that thicker twigs bear larger leaves. The exact nature of this relationship and why it should occur has been the subject of numerous studies. It is obvious that thicker twigs should support greater total leaf area ([Formula: see text]) for hydraulical and mechanical reasons. But it is not obvious why mean leaf size ([Formula: see text]) should scale positively with [Formula: see text] We asked what this scaling relationship is within species and how variable it is across species. We then developed a model to explain why these relationships exist.
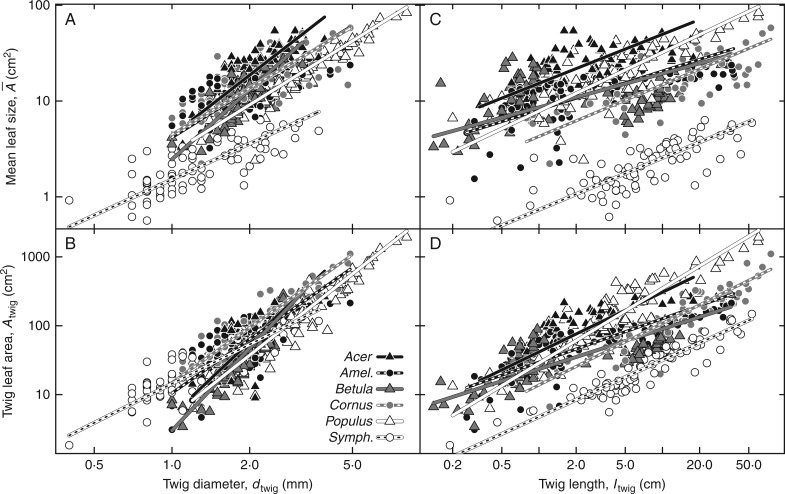
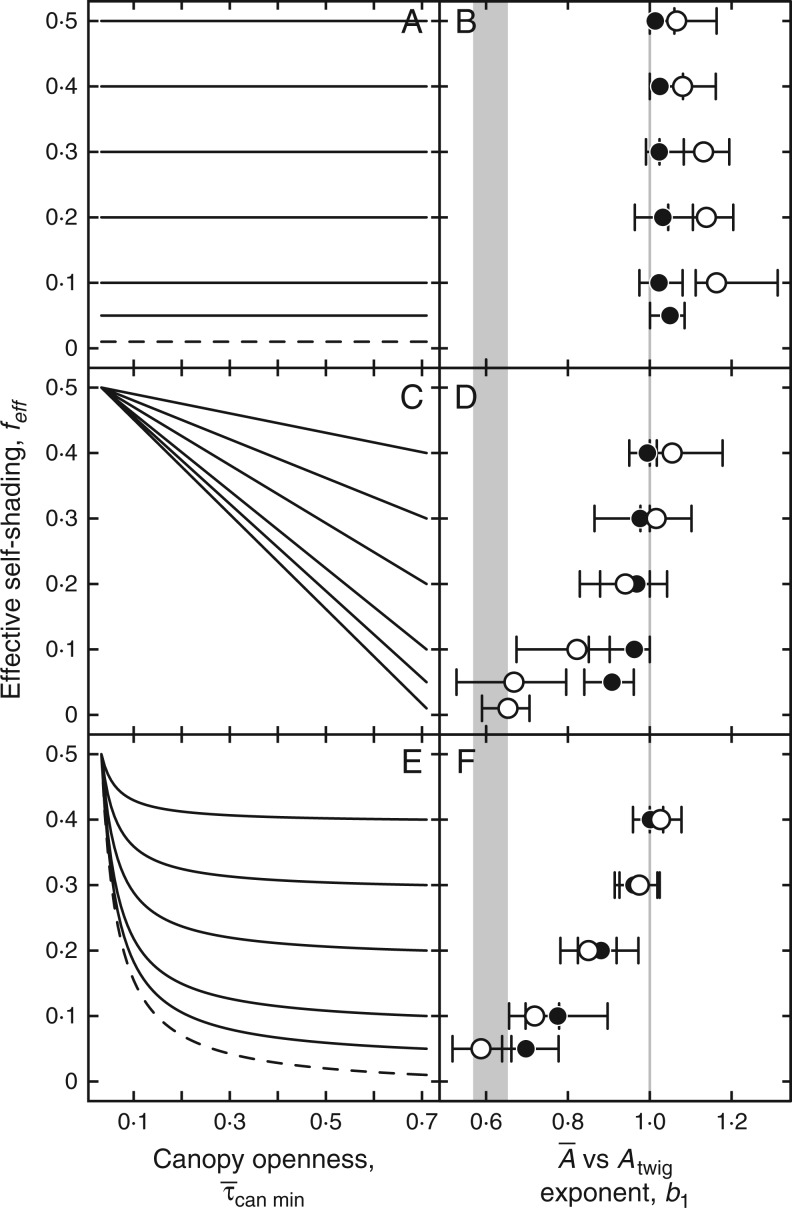
Methods: To minimize potential sources of variability, we compared twig properties from six co-occurring and functionally similar species: Acer grandidentatum, Amelanchier alnifolia, Betula occidentalis, Cornus sericea, Populus fremontii and Symphoricarpos oreophilus We modelled the economics of leaf display, weighing the benefit from light absorption against the cost of leaf tissue, to predict the optimal [Formula: see text] combinations under different canopy openings.
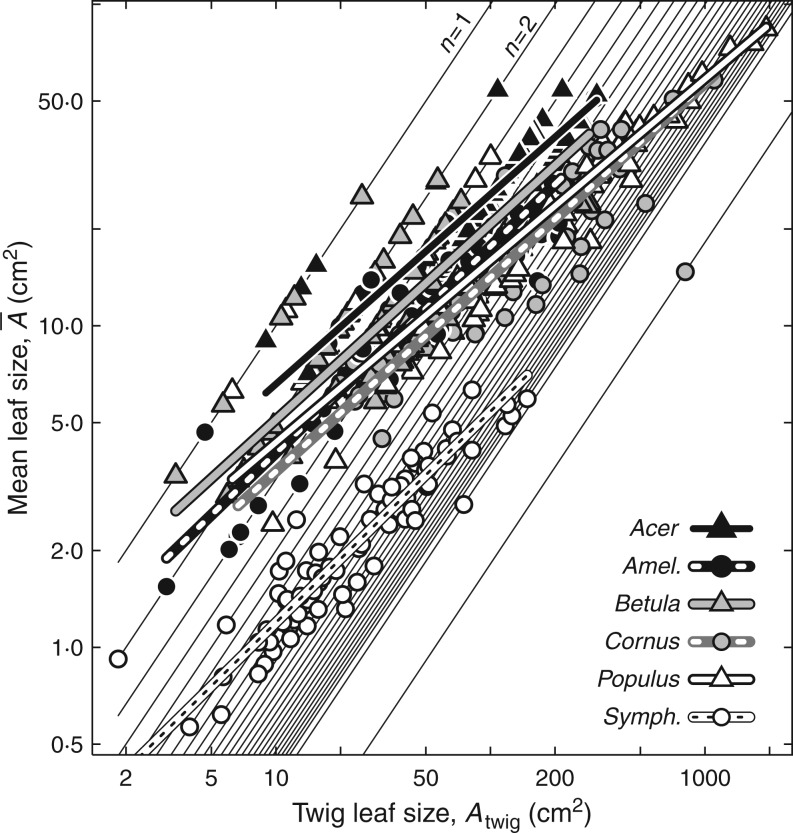
Key results: We observed a common [Formula: see text] by [Formula: see text] exponent of 0.6, meaning that [Formula: see text]and leaf number on twigs increased in a specific coordination. Common scaling exponents were not supported for relationships between any other measured twig properties. The model consistently predicted positive [Formula: see text] by [Formula: see text] scaling when twigs optimally filled canopy openings. The observed 0·6 exponent was predicted when self-shading decreased with larger canopy opening.
Conclusions: Our results suggest Corner's rule may be better understood when recast as positive [Formula: see text] by [Formula: see text] scaling. Our model provides a tentative explanation of observed [Formula: see text] by [Formula: see text] scaling and suggests different scaling may exist in different environments.
Keywords: Allometry; Corner’s rule; economics; intraspecific; leaf size; light interception; optimization; self-shading.
© The Author 2016. Published by Oxford University Press on behalf of the Annals of Botany Company. All rights reserved. For Permissions, please email: journals.permissions@oup.com.
Figures


References
-
- Bragg JG, Westoby M. 2002. Leaf size and foraging for light in a sclerophyll woodland. Functional Ecology 16: 633–639.
-
- Brouat C, Gibernau M, Amsellem L, McKey D. 1998. Corner’s rules revisited: ontogenetic and interspecific patterns in leaf-stem allometry. New Phytologist 139: 459–470.
-
- Campbell GS, Norman JN. 1998. An introduction to environmental biophysics, 2nd edn.New York: Springer.
-
- Corner EJH. 1949. The durian theory of the origin of the modern tree. Annals of Botany 13: 368–414.
-
- Cunningham SA, Summerhayes B, Westoby M. 1999. Evolutionary divergences in leaf structure and chemistry, comparing rainfall and soil nutrient gradients. Ecological Monographs 69: 569–588.
MeSH terms
LinkOut - more resources
Full Text Sources
Other Literature Sources
