. 2017 Feb;27(2):310-319.
doi: 10.1101/gr.205849.116. Epub 2016 Dec 27.

Model-based analysis of DNA replication profiles: predicting replication fork velocity and initiation rate by profiling free-cycling cells

Affiliations

Model-based analysis of DNA replication profiles: predicting replication fork velocity and initiation rate by profiling free-cycling cells

Ariel Gispan et al. Genome Res. 2017 Feb.

Abstract

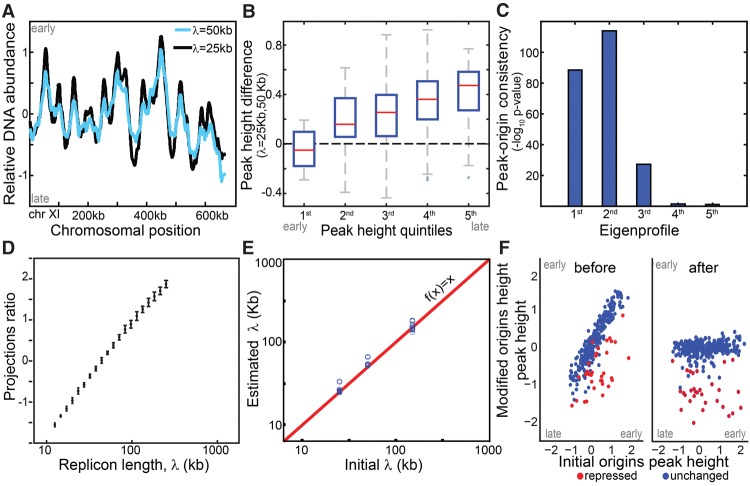
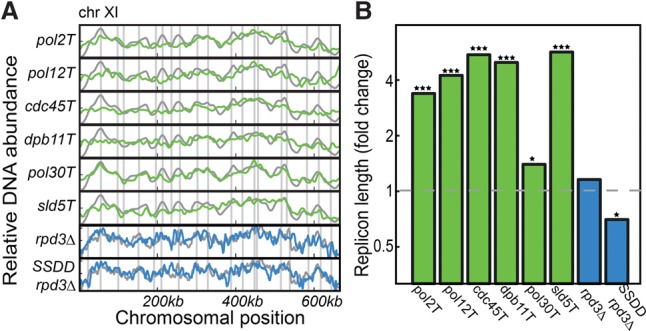
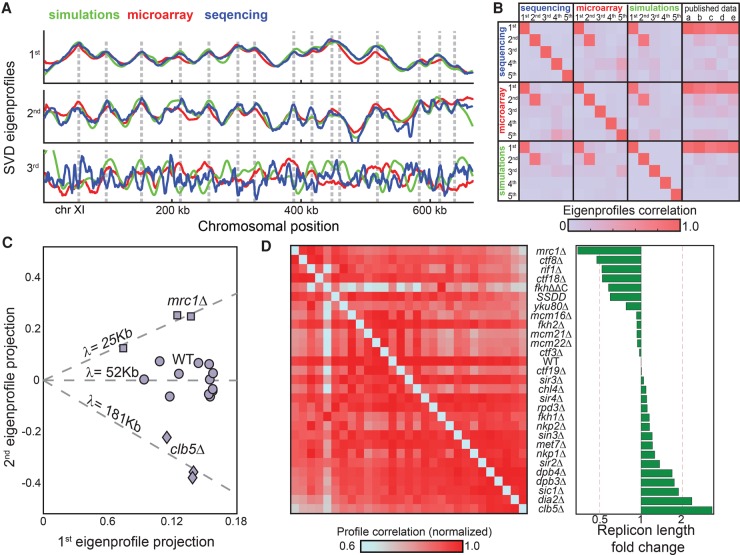
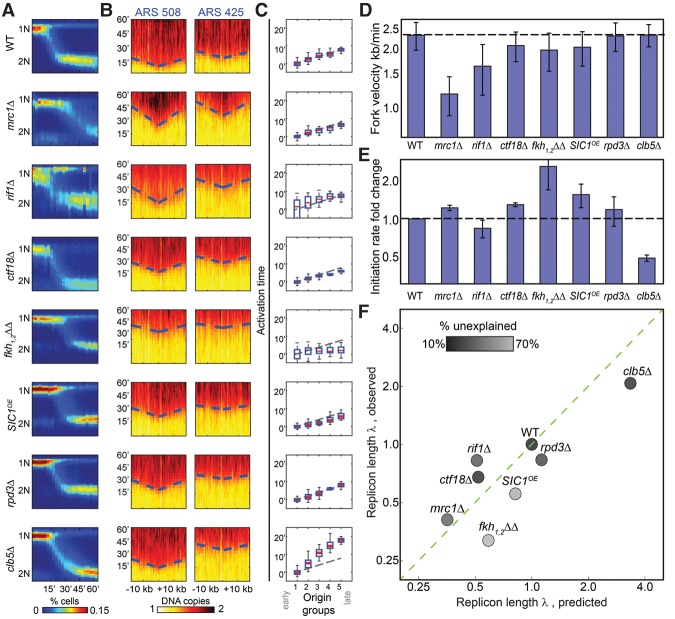
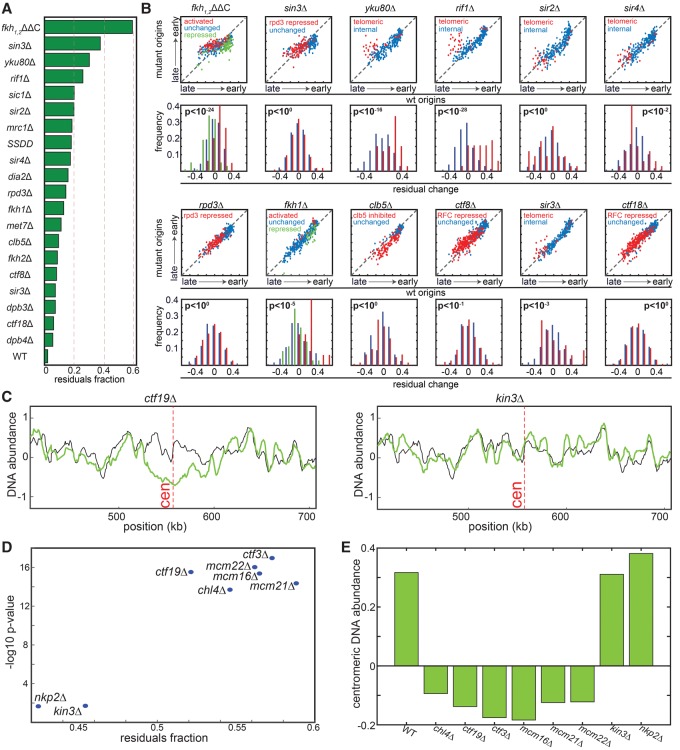
Eukaryotic cells initiate DNA synthesis by sequential firing of hundreds of origins. This ordered replication is described by replication profiles, which measure the DNA content within a cell population. Here, we show that replication dynamics can be deduced from replication profiles of free-cycling cells. While such profiles lack explicit temporal information, they are sensitive to fork velocity and initiation capacity through the passive replication pattern, namely the replication of origins by forks emanating elsewhere. We apply our model-based approach to a compendium of profiles that include most viable budding yeast mutants implicated in replication. Predicted changes in fork velocity or initiation capacity are verified by profiling synchronously replicating cells. Notably, most mutants implicated in late (or early) origin effects are explained by global modulation of fork velocity or initiation capacity. Our approach provides a rigorous framework for analyzing DNA replication profiles of free-cycling cells.


Figures

Figure 1.
Figure 1.
Simulation wild-type and mutated replication profiles. (A) Replication profile is sensitive to replicon length: Shown are simulated profiles corresponding to replicon lengths of λ = 25 kb (black) and λ = 50 kb (light blue). High DNA abundance indicates early replicating regions, and peaks represent replication origins. (B) Late origins show increased sensitivity to replicon length: Origin activation time was approximated by DNA content at the origin position (peak height). The figure compares activation times of all origins based on a reference and a perturbed profile (λ = 50 and 25 kb, respectively) grouped to quintiles. (C,D) Replicon length is retrieved using singular value decomposition (SVD). Origins were accurately predicted by the two leading eigenprofiles defined by SVD analysis (Methods) (C). Each profile was projected into the two leading eigenprofiles. This projection ratio is tightly correlated with the (log) replicon lengths (D). (E,F) Predicting origin-specific effects. Mutants that perturbed both the replicon length and origin-specific efficiencies were simulated. Replicon length was retrieved when projecting the simulated profile on the two leading eigenprofiles (E). Normalizing the replication profiles for the predicted changes in replicon lengths highlights origin-specific effects (F).
Figure 2.
Figure 2.
Replicon length is reduced when limiting abundance of initiation factors. Shown are the replication profiles (A, Chromosome XI) and the inferred replicon lengths (B), for the indicated genes expressed under the control of a TET-repressible promoter (green) and overexpression of the limiting factors SLD2, SLD3, DPB11, and DBF4 in the background of rpd3Δ ([Mantiero et al. 2011], denoted as SSDD rpd3Δ), with the rpd3Δ as control (blue). All experiments were done in duplicate, with the exception of rpd3Δ and SSDD rpd3Δ, which were done in triplicate, and the wild-type control, for which 13 independent replicates were performed. All changes in λ were significant, based on a one-sided two sample t-test between replicates (P-value = 0.01 for pol30Δ mutant, <10−10 for all other mutants showing higher λ, and 0.04 for the lower λ of SSDD rpd3Δ; the rpd3Δ control showed no significance at all). (*) P < 0.05, (***) P < 0.001.
Figure 3.
Figure 3.
S phase mutants differ in their replicon lengths. (A) SVD analysis of a compendium of budding yeast mutant profiles: The three leading eigenprofiles defined by SVD analysis of experimental and simulated data sets are shown (blue, red, and green; Chromosome XI). (B) Distinct data sets define the same two leading eigenprofiles. Shown are the correlations between the five leading eigenprofiles from each data set (simulations, microarray, and sequencing), and their correlations with previously published wild-type data: (a) Alvino et al. (2007); (b) Feng et al. (2006); (c) McCune et al. (2008); (d) Müller and Nieduszynski (2012); and (e) Raghuraman et al. (2001). (C) Predicted replicon lengths are consistent between replicates. The replication profiles of wild-type cells, cells deleted of CLB5, and cells deleted of MRC1 were measured with 12, four, and three replicates, respectively. Shown are the projections of each individual repeat on the two leading eigenprofiles. The (log) replicon length is predicted by the slope (projection ratio). (D) Predicted replicon lengths. Shown are the predicted replicon lengths for the mutants in our data set. The left panel shows the correlation between respective profiles. For each mutant, correlation values were normalized by their maximum to control for differences in noise levels.
Figure 4.
Figure 4.
Temporal profiling validates predicted changes in fork velocity and initiation rates. (A) Synchronous progression through S phase. Cells were followed for 60 min following release from α-factor arrest and sampled at 3-min time resolution. Shown in color-code are the distributions of total DNA content (y-axis, measured using flow-cytometer) at different times (x-axis) for the indicated mutants. (B) Defining fork velocity from the temporal progression of replication around replication origins. Shown in color-code are DNA content around early (ARS508) and late (ARS425) origins (x-axis, measured using whole-genome sequencing) as a function of time (y-axis). Fork velocity is estimated by the slope, obtained by linear fit (dashed blue lines) of the estimated times at which different genomic regions around the origins replicated (trep, black). (C) Defining origin activation time from the gradual delay in origin activation time. Origins were classified into five groups based on their wild-type efficiency. Shown is the average activation time for origins in each cluster. Initiation capacity is inferred by the proportional delay in activation time between clusters (Supplemental Material). (D) Fork velocities of the indicated mutants. Velocities shown are an average over all origins. (E) Initiation capacities of the indicated mutants. Initiation capacity was inferred from the proportional delay in activation time between clusters, as shown in B (Supplemental Material). (F) Measured replicon lengths tightly correlated with the predicted values. Replicon lengths were calculated from the measured fork velocity v and initiation capacity l (λ = v/I) and are shown as a function of the replicon length predicted form the respective profiles of free-cycling cells. Both measures are normalized by the wild-type value. The shading-code indicates the extent to which the mutant profile is explained by the model assuming no origin-specific effects (residual score; black indicates high agreement) (Supplemental Material).
Figure 5.
Figure 5.
Mutants showing origin-specific effects. (A) Scoring mutants by the fraction of replication profile not explained by global changes. Shown are the fractions of the variances of the measured replication signals not explained by a model assuming no origin-specific effects. (B) Change in the replication timings of individual origins: For each mutant, the upper figure shows the inferred replication timing (DNA abundance) of each origin in the mutant vs. wild type. The group of origins predefined in previous experiments as regulated in the respective mutant is color-coded. The distributions of residual changes, following normalization by the predicted replicon length, are also shown (lower panel). P-values are measured based on a two-sample t-test (or one-way ANOVA in the case of the number of groups > 2) comparing the distribution of residuals in the regulated vs. unregulated origin groups. Origin classification is based on the following references: fkh1,2ΔΔC and fkh1Δ taken from Knott et al. (2012); rpd3Δ and sin3Δ were classified based on the up-regulated origins in rpd3Δ from Knott et al. (2009); ctf8Δ and ctf18Δ classification was taken from Crabbe et al. (2010). Classification of clb5Δ origins was taken from McCune et al. (2008). Subtelomeric origins in yku80Δ, rif1Δ, sir2Δ, sir3Δ, and sir4Δ were defined within 50 kb from the telomeres (Methods). (C) Replication profile around centromeres. Shown are the replication profiles around the centromere (marked in a dashed red line) of Chromosome 16 for the indicated strains (green) compared to the wild-type strain (black). (D) The unexplained profile score correlates with local changes. For the indicated strains, the unexplained percentage of the signal (x-axis) is compared to the significance of change in centromere replication. Significance is defined by the −log10(P-value) of a t-test comparing changes in replication time of centromeric vs. noncentromeric origins (y-axis). (E) DNA abundance around centromeric regions. Shown are 10-kb windows around the centromere for the indicated strains.

References

    1. Altenbern RA. 1971. Marker frequency analysis mapping of the Staphylococcus aureus chromosome. Can J Microbiol 17: 903–909. - PubMed
    1. Alter O, Brown PO, Botstein D. 2000. Singular value decomposition for genome-wide expression data processing and modeling. Proc Natl Acad Sci 97: 10101–10106. - PMC - PubMed
    1. Alvino GM, Collingwood D, Murphy JM, Delrow J, Brewer BJ, Raghuraman MK. 2007. Replication in hydroxyurea: It's a matter of time. Mol Cell Biol 27: 6396–6406. - PMC - PubMed
    1. Aparicio JG, Viggiani CJ, Gibson DG, Aparicio OM. 2004. The Rpd3-Sin3 histone deacetylase regulates replication timing and enables intra-S origin control in Saccharomyces cerevisiae. Mol Cell Biol 24: 4769–4780. - PMC - PubMed
    1. Baker A, Bechhoefer J. 2014. Inferring the spatiotemporal DNA replication program from noisy data. Phys Rev E Stat Nonlin Soft Matter Phys 89: 32703. - PubMed

MeSH terms