. 2017 Jan;56(1):156-164.
doi: 10.1093/rheumatology/kew355. Epub 2016 Oct 7.

Cartilage biomarkers in the osteoarthropathy of alkaptonuria reveal low turnover and accelerated ageing

Affiliations

Cartilage biomarkers in the osteoarthropathy of alkaptonuria reveal low turnover and accelerated ageing

Adam M Taylor et al. Rheumatology (Oxford). 2017 Jan.

Abstract

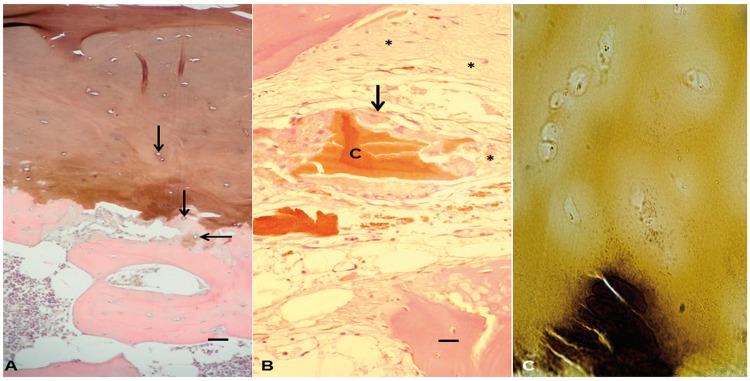
Objective: Alkaptonuria (AKU) is a rare autosomal recessive disease resulting from a single enzyme deficiency in tyrosine metabolism. As a result, homogentisic acid cannot be metabolized, causing systemic increases. Over time, homogentisic acid polymerizes and deposits in collagenous tissues, leading to ochronosis. Typically, this occurs in joint cartilages, leading to an early onset, rapidly progressing osteoarthropathy. The aim of this study was to examine tissue turnover in cartilage affected by ochronosis and its role in disease initiation and progression.

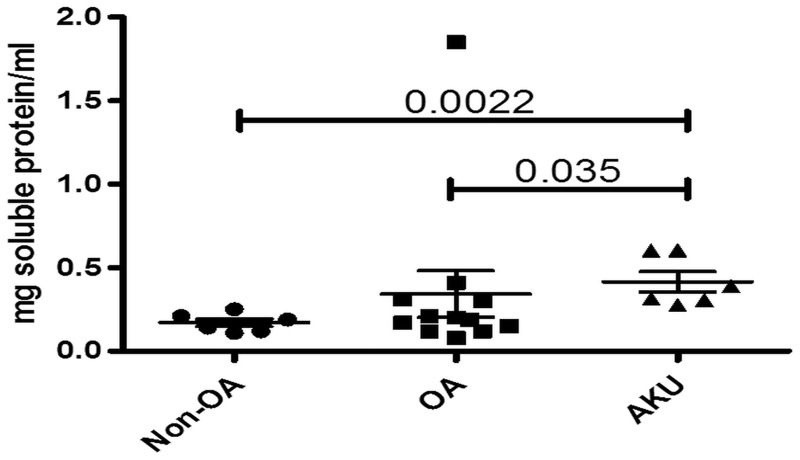
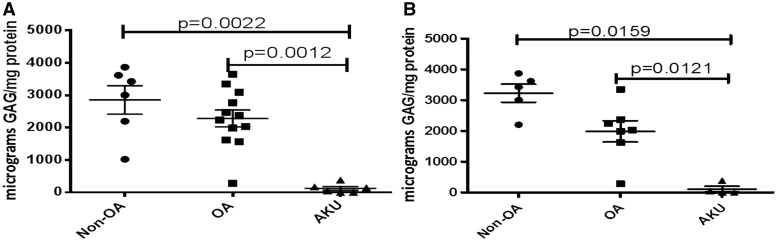
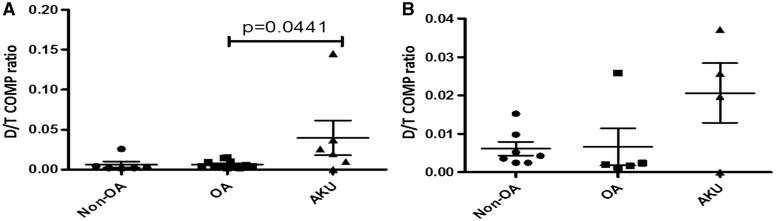
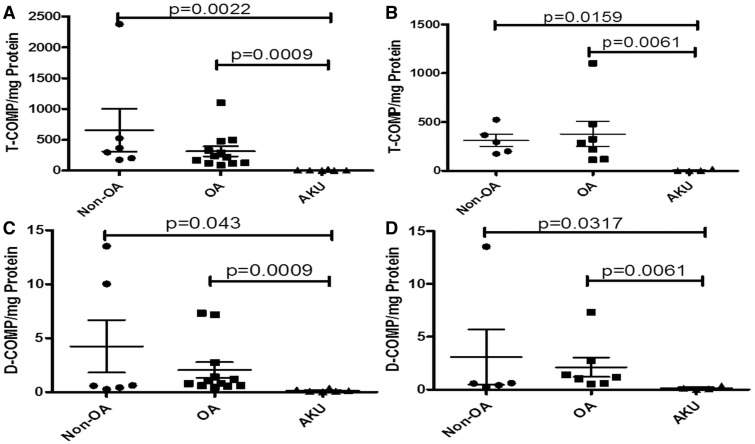
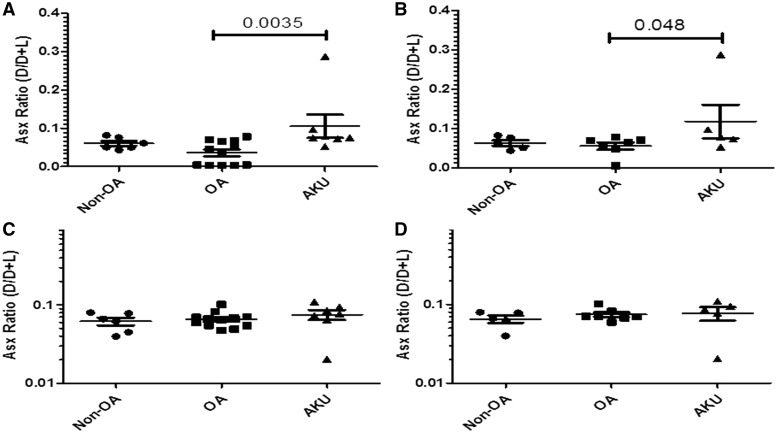
Methods: With informed patient consent, hip and knee cartilages were obtained at surgery for arthropathy due to AKU (n = 6; 2 knees/4 hips) and OA (n = 12; 5 knees/7 hips); healthy non-arthritic (non-OA n = 6; 1 knee/5 hips) cartilages were obtained as waste from trauma surgery. We measured cartilage concentrations (normalized to dry weight) of racemized aspartate, GAG, COMP and deamidated COMP (D-COMP). Unpaired AKU, OA and non-OA samples were compared by non-parametric Mann-Whitney U test.

Results: Despite more extractable total protein being obtained from AKU cartilage than from OA or non-OA cartilage, there was significantly less extractable GAG, COMP and D-COMP in AKU samples compared with OA and non-OA comparators. Racemized Asx (aspartate and asparagine) was significantly enriched in AKU cartilage compared with in OA cartilage.

Conclusions: These novel data represent the first examination of cartilage matrix components in a sample of patients with AKU, representing almost 10% of the known UK alkaptonuric population. Compared with OA and non-OA, AKU cartilage demonstrates a very low turnover state and has low levels of extractable matrix proteins.

Keywords: ageing; alkaptonuria; biomarkers; cartilage oligomeric matrix protein; glycosaminoglycan; ochronosis; osteoarthritis; racemization.


Figures

F<sc>ig</sc>. 1
Fig. 1
Higher total protein in alkaptonuria and OA cartilage compared with non-OA samples Graph showing extractable protein (milligram soluble protein per millilitre) from AKU (n = 6), OA (n = 12) and non-OA (n = 6) independent cartilage specimens. Error bars represent the mean of the n in each group ±95% CI. AKU: alkaptonuria.
F<sc>ig</sc>. 2
Fig. 2
Lower GAG in alkaptonuria cartilage compared with OA and non-OA samples Graph showing extractable GAG (microgram GAG per milligram protein) from AKU (n = 6), OA (n = 12) and non-OA (n = 6) independent cartilage specimens. (A) All samples, both hips and knees. (B) Hip-only samples. Error bars represent the mean of the n in each group ±95% CI. AKU: alkaptonuria.
F<sc>ig</sc>. 3
Fig. 3
Higher delaminated to total COMP ratio in alkaptonuria cartilage compared with OA cartilage Graph showing extractable D-COMP as a proportion of total COMP (D/T) from AKU (n = 6), OA (n = 12) and non-OA (n = 6) independent cartilage specimens. (A) All samples, both hips and knees. (B) Hip-only samples. Error bars represent the mean of the n in each group ±95% CI. D-COMP: deamidated COMP; AKU: alkaptonuria; D/T: D-COMP to T-COMP ratio.
F<sc>ig</sc>. 4
Fig. 4
Lower total COMP and lower deamidated COMP in alkaptonuria cartilage compared with OA and non-OA cartilage Graph showing extractable T-COMP (T-COMP per milligram protein) from AKU (n = 6), OA (n = 12) and non-OA (n = 6) cartilage specimens. (A) All samples, both hips and knees. (B) Hip-only samples. Graph showing extractable D-COMP (D-COMP/mg protein) from AKU (n = 6), OA (n = 12) and non-OA (n = 6) cartilage specimens. (C) All samples, both hips and knees. (D) Hip-only samples. Error bars represent the mean of the n in each group ±95% CI. D-COMP: deamidated COMP; T-COMP: total COMP; AKU: alkaptonuria.
F<sc>ig</sc>. 5
Fig. 5
Racemized Asx content in PBS and insoluble extract alkaptonuric cartilage vs OA and non-OA Graphs showing the amount of racemized Asx (D form) as a proportion of non-racemized Asp (L form) represented by the D/D+L ratio in AKU, OA and non-OA cartilage specimens. (A) Asx ratio (D/D+L) in PBS extract of all samples: both hips and knees from AKU (n = 6), OA (n = 12) and non-OA (n = 6) independent cartilage specimens. (B) Asx ratio (D/D+L) in PBS extract from hip-only samples from AKU (n = 4), OA (n = 7) and non-OA (n = 5) independent cartilage specimens. (C) Asx ratio (D/D+L) in insoluble extract of all samples: both hips and knees from AKU (n = 6), OA (n = 12) and non-OA (n = 6) independent cartilage specimens, (D) Asx ratio (D/D+L) in insoluble extract from hip-only samples from AKU (n = 4), OA (n = 7) and non-OA (n = 5) for independent cartilage specimens. Error bars represent the mean of the n in each group ± 95% CI. AKU: alkaptonuria; racemized Asx: aspartate and asparagine; Asp: aspartate; D: dextrorotary (d-isomer); L: levorotary (l-isomer).
F<sc>ig</sc>. 6
Fig. 6
H&E-stained section of alkaptonuric femoral head (A) Histological section showing full depth articular cartilage pigmentation with numerous empty chondrocyte lacunae (arrows). There is pericellular pigmentation around chondrocyte lacunae in the calcified cartilage. There are also areas where the calcified cartilage is not continuous with either the subchondral bone below it or the hyaline articular cartilage above it. Bar = 50 µm. (B) Shards of pigmented cartilage can be seen impacted within the marrow space of the bone marrow cavity (‘C’). The cartilage is surrounded by inflammatory cells, some of which show intracellular pigmentation (arrow). The fibrous tissue response of the marrow cavity can be seen in numerous strands of matrix peripherally around the cartilage (asterisk). Bar = 10 µm. (C) A 10-µm non-decalcified cryostat section of AKU tissue stained with von Kossa. Densely mineralized bone (black) can be seen beneath isogenous zones of chondrocytes located in the hyaline articular cartilage, which shows ochronontic colouration but absence of the similar black staining that would indicate calcium deposition.

References

    1. Kraus VB. Rare osteoarthritis: ochronosis and Kashin-Beck disease In: Hochberg MC, Silman AJ, Smolen JS, Weinblatt ME, Weisman MH, eds. Rheumatology, 6th edn, Chapter 185. Philadelphia: Mosby Elsevier, 2014: 1536–40.
    1. Mistry JB, Bukhari M, Taylor AM. Alkaptonuria. Rare Dis 2013;1:e27475. - PMC - PubMed
    1. Garrod AE. The incidence of alkaptonuria: a study in chemical individuality. Lancet 1902;II:1616–20. - PMC - PubMed
    1. Ranganath L, Taylor AM, Shenkin A. et al. Identification of alkaptonuria in the general population: a United Kingdom experience describing the challenges, possible solutions and persistent barriers. J Inherit Metab Dis 2011;34:723–30. - PubMed
    1. Taylor AM, Wilson PJ, Ingrams DR. et al. Calculi and intracellular ochronosis in the submandibular tissues from a patient with alkaptonuria. J Clin Pathol 2010;63:186–8. - PubMed

Publication types

MeSH terms