. 2017 Jan 10;114(2):E132-E141.
doi: 10.1073/pnas.1619659114. Epub 2016 Dec 27.

Ohr plays a central role in bacterial responses against fatty acid hydroperoxides and peroxynitrite

Affiliations

Ohr plays a central role in bacterial responses against fatty acid hydroperoxides and peroxynitrite

Thiago G P Alegria et al. Proc Natl Acad Sci U S A. .

Abstract

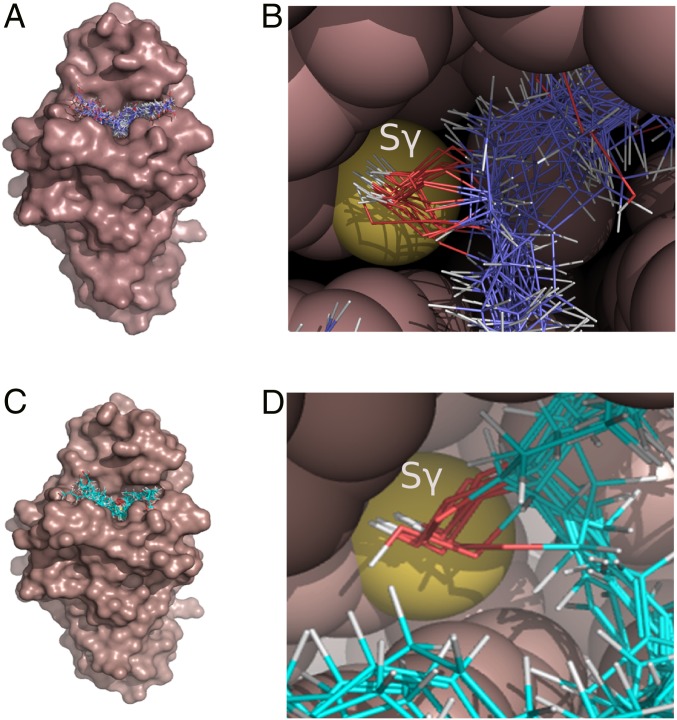
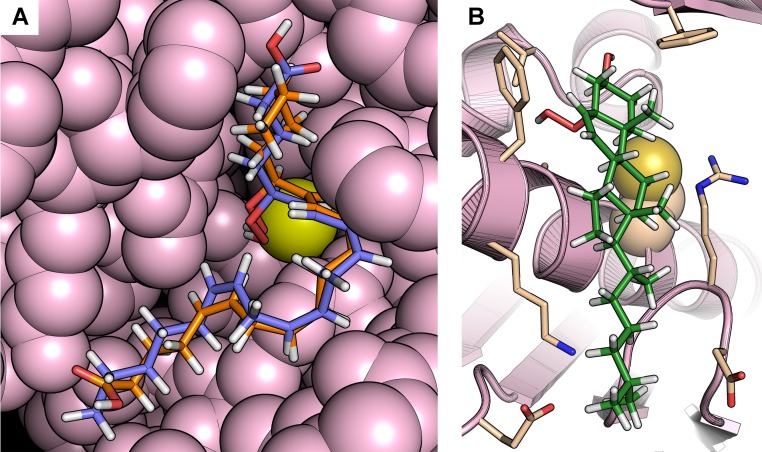
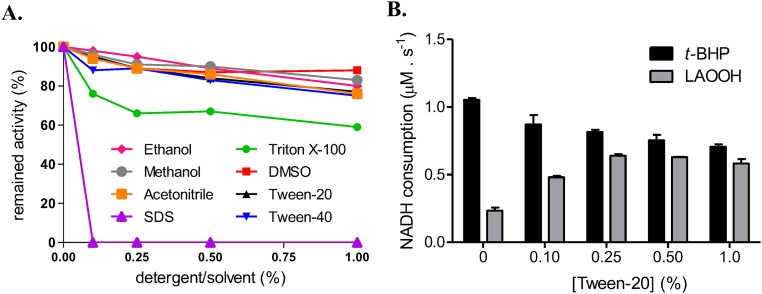
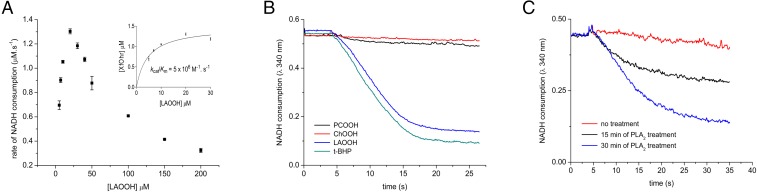
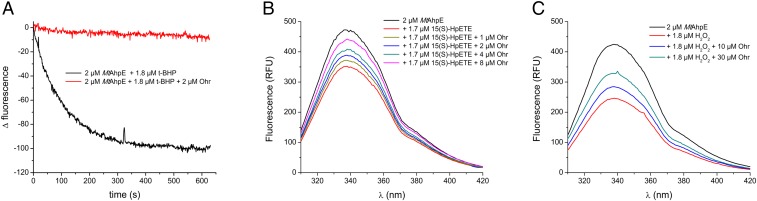
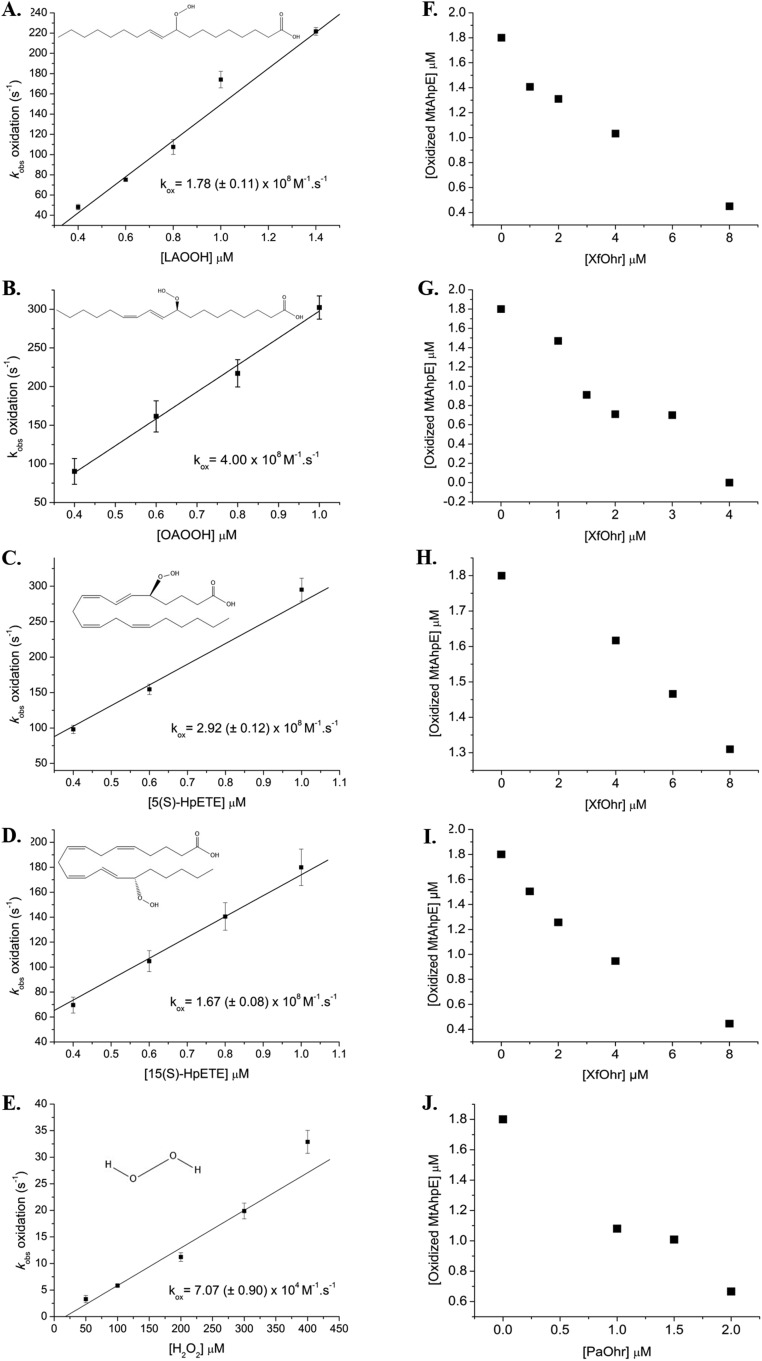
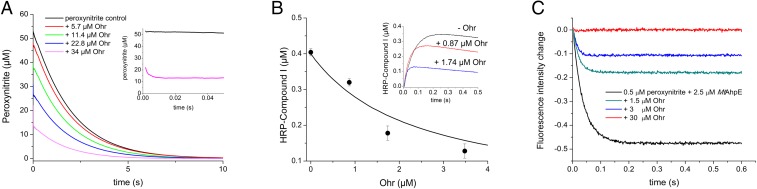
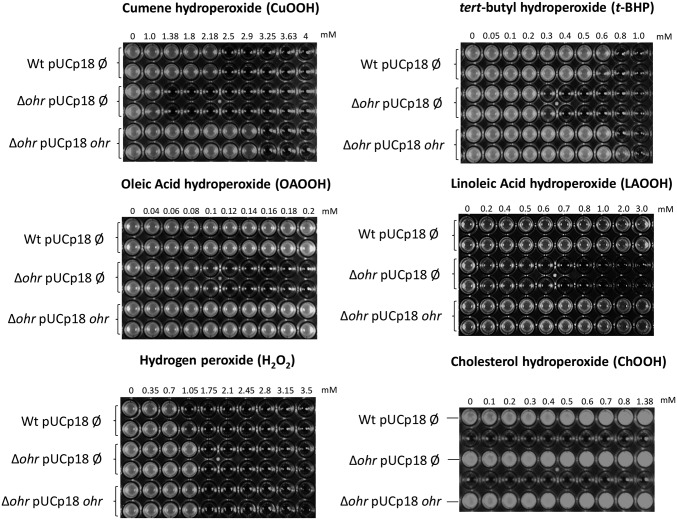
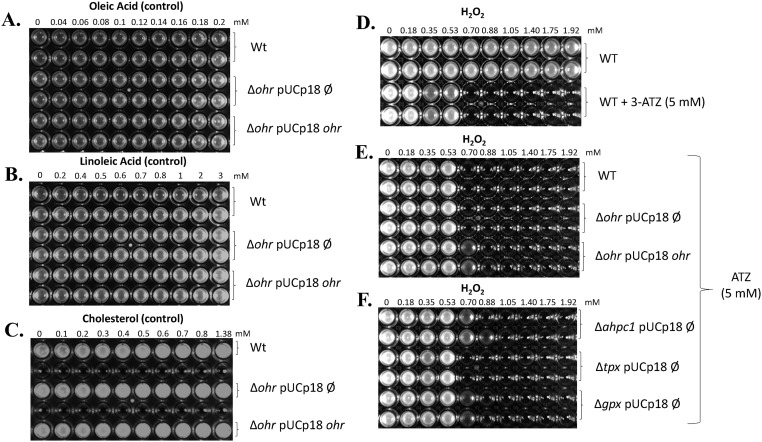
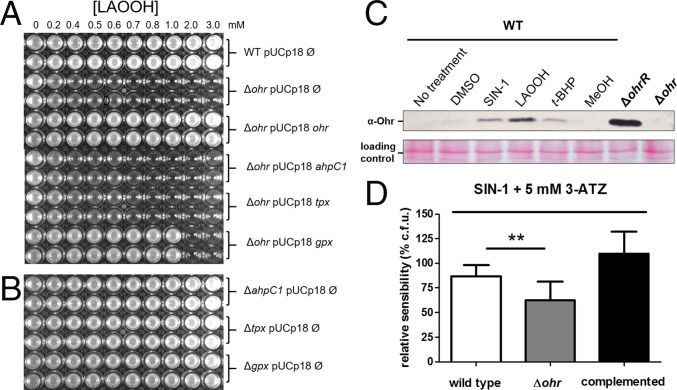
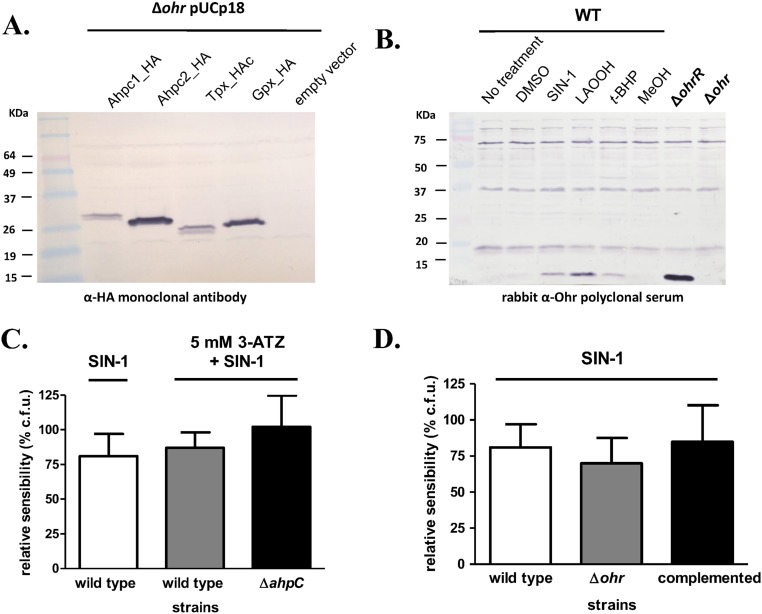
Organic hydroperoxide resistance (Ohr) enzymes are unique Cys-based, lipoyl-dependent peroxidases. Here, we investigated the involvement of Ohr in bacterial responses toward distinct hydroperoxides. In silico results indicated that fatty acid (but not cholesterol) hydroperoxides docked well into the active site of Ohr from Xylella fastidiosa and were efficiently reduced by the recombinant enzyme as assessed by a lipoamide-lipoamide dehydrogenase-coupled assay. Indeed, the rate constants between Ohr and several fatty acid hydroperoxides were in the 107-108 M-1⋅s-1 range as determined by a competition assay developed here. Reduction of peroxynitrite by Ohr was also determined to be in the order of 107 M-1⋅s-1 at pH 7.4 through two independent competition assays. A similar trend was observed when studying the sensitivities of a ∆ohr mutant of Pseudomonas aeruginosa toward different hydroperoxides. Fatty acid hydroperoxides, which are readily solubilized by bacterial surfactants, killed the ∆ohr strain most efficiently. In contrast, both wild-type and mutant strains deficient for peroxiredoxins and glutathione peroxidases were equally sensitive to fatty acid hydroperoxides. Ohr also appeared to play a central role in the peroxynitrite response, because the ∆ohr mutant was more sensitive than wild type to 3-morpholinosydnonimine hydrochloride (SIN-1 , a peroxynitrite generator). In the case of H2O2 insult, cells treated with 3-amino-1,2,4-triazole (a catalase inhibitor) were the most sensitive. Furthermore, fatty acid hydroperoxide and SIN-1 both induced Ohr expression in the wild-type strain. In conclusion, Ohr plays a central role in modulating the levels of fatty acid hydroperoxides and peroxynitrite, both of which are involved in host-pathogen interactions.

Keywords: Cys-based peroxidase; Pseudomonas aeruginosa; hydroperoxides; pathogenic bacteria; thiols.


Conflict of interest statement

The authors declare no conflict of interest.

Figures

Fig. 1.
Fig. 1.
Molecular docking of long-chain hydroperoxides into the Ohr active site pocket. The molecular surface of XfOhr (PDB ID code 1ZB8) is represented in brown, whereas the hydroperoxides are shown as lines with the atoms colored as follows: carbon = purple (A and B) and cyan (C and D), oxygen = red, and hydrogen = white. (A and C) Results of docking simulations, showing the entire protein structure. Ligands used hydroperoxides derived from OAOOH, palmitoleic acid hydroperoxide, and LAOOH (A) and arachidonic acid hydroperoxide (C): 5-HpETE, 5(S)-HpETE, 8-HpETE, 9-HpETE, 12-HpETE, 15-HpETE, and 15(S)-HpETE. Oleic and linoleic acid molecules containing the hydroperoxide group in both the cis- and trans-configurations or in different combinations of the two (linoleic hydroperoxides) were considered in the analysis. (B and D) Details of the Ohr active site pocket, showing the hydroperoxide groups of the fatty acid hydroperoxides facing toward the Sγ of Cys61. The atoms of the enzyme are represented as space-filling spheres and colored brown, except for the sulfur atom of Cys61 (yellow). The docking procedures were performed using Gold software (70), and molecular graphics were generated using PyMOL (www.pymol.org/).
Fig. S1.
Fig. S1.
Representative docking poses. (A) Representative docking poses of 5(S)-HpETE and 15(S)-HpETE in the XfOhr active site showing great similarity in the overall conformation of the hydrocarbon chains of these arachidonic acid derivatives. In both cases, the hydroperoxide groups are positioned close to Cys61 (yellow), although their carboxyl groups are positioned on opposite sides of the active site. The atoms belonging to the enzyme are represented as spheres and colored in light pink. The 5(S)-HpETE is shown in blue, and the 15(S)-HpETE is shown in orange. (B) Docking of cholesterol-5α-hydroperoxide in the XfOhr active site. Note the hydroperoxide group faces away from Cys61 (yellow), whose side chain is represented as spheres. XfOhr is colored in light pink and represented as a cartoon. Residues within 4 Å of the cholesterol-5α-hydroperoxide molecule are colored in beige and represented as sticks, whereas cholesterol-5α-hydroperoxide itself is colored in green.
Fig. S2.
Fig. S2.
XfOhr activity in the presence of various solvents and detergents. (A) XfOhr activity was assessed by the NADH lipoamide-lipoamide dehydrogenase–coupled assay toward t-BHP, in the presence of various concentrations of solvents and detergents. One hundred percent of activity was considered the rate of NADH consumption at standard conditions (XfOhr = 0.05 μM, lipoamide dehydrogenase from X. fastidiosa (XfLpD) = 0.5 μM, dihydrolipoamide = 50 μM, t-BHP = 100 μM, and NADH = 200 μM). The results represent an arithmetic average of two independent experiments. (B) Effect of Tween-20 concentration on XfOhr activity. Reduction of t-BHP and LAOOH by XfOhr followed by the lipoamide-lipoamide dehydrogenase–coupled assay [XfOhr = 0.05 μM, XfLpD = 0.5 μM, dihydrolipoamide = 50 μM, and hydroperoxides (t-BHP and LAOOH) = 100 μM]. The assays were performed twice.
Fig. 2.
Fig. 2.
Lipoamide-lipoamide dehydrogenase–coupled assay for the reduction of lipid hydroperoxides by XfOhr. Peroxidase activity was monitored by the consumption of NADH at 340 nm in the presence of XfOhr (0.05 μM), lipoamide dehydrogenase from X. fastidiosa (XfLpD, 0.5 μM), and lipoamide (50 μM) in sodium phosphate buffer (20 mM, pH 7.4) and DTPA (1 mM). (A) Dose-dependent reduction of LAOOH by XfOhr in the presence of Tween-20 (0.25%). (Inset) Plot of the rates of NADH oxidation, considering points up to 20-μM concentration of LAOOH. (B) Reduction of hydroperoxides (100 μM) in the presence of Triton X-100 (0.15%). PCOOH, phosphatidylcholine hydroperoxide. (C) Peroxidase activity of Ohr on PCOOH, measured after indicated time of treatment with PLA2.
Fig. S3.
Fig. S3.
Mass spectrometry analysis of the products formed in the XfOhr reaction with LAOOH and OAOOH. (AC) Chromatographic profile (Left) and mass spectrum (Right) of LAOOH. (A) Control, LAOOH in the absence of XfOhr. (B) Product of the reaction between XfOhr and LAOOH. (C) Product of the reaction between LAOOH and XfOhr previously alkylated with NEM. (D and E) Tandem mass spectometry (MS/MS) spectrum of the authentic linoleic acid hydroxide standard (fragment ions of m/z = 295) and for the ions formed in the Ohr reaction, respectively. (FH) Chromatographic profile (Left) and mass spectrum (Right) of OAOOH. (F) Control reaction: OAOOH in the absence of XfOhr. (G) Product of the reaction between XfOhr and OAOOH. (H) Product of the reaction between OAOOH and XfOhr previously alkylated with NEM. (I and J) MS/MS spectrum of the authentic oleic acid hydroxide standard (fragment ions of m/z = 297) and for the ions formed in the XfOhr reaction, respectively. Arrows show similar peaks in both samples.
Fig. 3.
Fig. 3.
Inactivation/hyperoxidation of Ohr. (A) Schematic catalytic cycle of Ohr and its hyperoxidation: Reaction of reduced Ohr with hydroperoxides generates the peroxidatic Cys (Cysp)-SOH intermediate, which undergo condensation with resolution Cys (CysR = Cys125). This intramolecular disulfide runs faster than the reduced form in nonreducing SDS/PAGE (22). The intramolecular disulfide can be reduced back by dihydrolipoamide. In the presence of high amounts of organic hydroperoxides, Cysp-SOH can be further oxidized to Cysp-SO2H (sulfinic acid) or Cysp-SO3H (sulfonic acid), which comigrates with the reduced form of Ohr in SDS/PAGE. Cysp-SO2H or Cysp-SO3H cannot be reduced by dihydrolipoamide. (B) Oxidative inactivation/hyperoxidation of XfOhr by various hydroperoxides in the presence of 0.1% Triton X-100. Reduced XfOhr (10 μM) was incubated for 1 h at 37 °C with distinct hydroperoxides at the indicated concentrations: OAOOH (a), LAOOH (b), t-BHP (c), CHP (d), ChOOH (e), and H2O2 (f). Main panels illustrate residual activity measured by the lipoamide-lipoamide dehydrogenase–coupled assay, using 200 μM t-BHP as a substrate, in the presence of 0.05 μM XfOhr, 0.5 μM lipoamide dehydrogenase from X. fastidiosa (XfLpD), and 50 μM dihydrolipoamide. Each point represents an average of triplicates, and the respective bars correspond to the SD. (Insets) Nonreducing SDS/PAGE, with each well corresponding to an aliquot of Ohr incubated with different concentrations of hydroperoxides (0, 10, 20, 50, and 100 μM). In each well, 2 μg of total protein was applied.
Fig. S4.
Fig. S4.
Oxidative inactivation of XfOhr by various hydroperoxides in the presence of 0.25% of Tween-20. Reduced XfOhr (10 μM) was incubated for 1 h at 37 °C with distinct hydroperoxides at the indicated concentrations: OAOOH (A), LAOOH (B), t-BHP (C), CHP (D), and ChOOH (E). Main panels show residual activity measured by the lipoamide-lipoamide dehydrogenase–coupled assay, using 200 μM t-BHP as a substrate, in the presence of 0.05 μM XfOhr, 0.5 μM lipoamide dehydrogenase from X. fastidiosa (XfLpD), and 50 μM dihydrolipoamide. Each point represents an average of triplicates, and the respective bars correspond to the SD. (Insets) Nonreducing SDS/PAGE, with each well corresponding to an aliquot of Ohr incubated with different concentrations of hydroperoxides (0, 10, 20, 50, and 100 μM). In each well, 2 μg of total protein was applied.
Fig. S5.
Fig. S5.
Intrinsic fluorescence of MtAhpE. (A) Intrinsic fluorescence of MtAhpE and XfOhr in their reduced (represented in black and blue lines, respectively) and oxidized (red and green lines, respectively) states. (B) Emission spectra of MtAhpE (2 μM) in the reduced (black line) or oxidized (red line) state by 15(S)-HpETE (1.8 μM) or in the presence of native (green line) or NEM alkylated (blue line) XfOhr (16 μM). RFU, relative fluorescence units.
Fig. 4.
Fig. 4.
AhpE/XfOhr competitive assay for distinct hydroperoxides. Reactions were carried out in potassium phosphate buffer (100 mM) and DTPA (50 μM), pH 7.4, at 25 °C. (A) MtAhpE (2 μM) and t-BHP (1.8 μM) in the presence (red line) or absence (black line) of XfOhr (2 μM). (B) Emission spectrum of MtAhpE (2 μM) in the reduced state (black) and after oxidation by 1.7 μM 15(S)-HpETE (red). To the reaction mixture represented by the red line, XfOhr was added at the following concentrations: 1.0 μM (brown), 2.0 μM (blue), 4.0 μM (green), and 8.0 μM (purple). (C) Emission spectrum of AhpE (2 μM) in the reduced state (black) and after oxidation by 1.8 μM hydrogen peroxide (red). To the reaction mixture represented by red line, XfOhr was added at the following concentrations: 10.0 μM (blue) and 30.0 μM (green). RFU, relative fluorescence units.
Fig. S6.
Fig. S6.
AhpE/Ohr competition assay. Plots of kobs of MtAhpE oxidation by LAOOH (A), OAOOH (B), 5(S)-HpETE (C), 15(S)-HpETE (D), and H2O2 (E). kox, second-order rate constant for the oxidation of MtAhpE by various peroxides. Total fluorescence was measured at fluorescence intensity (λex) of 280 nm using 0.2 μM MtAhpE. Chemical structures of hydroperoxides were obtained from https://pubchem.ncbi.nlm.nih.gov/. Effects of increasing concentration of XfOhr on MtAhpE oxidation by LAOOH (F), OAOOH (G), 5(S)-HpETE (H), and 15(S)-HpETE (I). (J) Effect of increasing concentration of PaOhr on MtAhpE oxidation by OAOOH.
Fig. 5.
Fig. 5.
Peroxynitrite reduction by XfOhr. Reactions were carried out in potassium phosphate buffer (100 mM), DTPA (100 μM), pH 7.4, at 25 °C. (A) Peroxynitrite (50 μM) was rapidly mixed with reduced Ohr at increasing concentrations, and oxidant decay was followed by its intrinsic absorbance at 310 nm. (B) Peroxynitrite (0.4 μM) was mixed with HRP (10 μM) in the absence and presence of increasing concentrations of reduced Ohr. HRP-compound I formation was monitored at the Soret band. The line represents the expected results simulated using the Gepasi program (76), and considering a simple competition between reduced XfOhr and HRP for peroxynitrite, a rate constant of HRP-mediated peroxynitrite reduction of 2.2 × 10⁶ M−1⋅s−1 and a rate constant of XfOhr-mediated peroxynitrite reduction of 1.2 × 10⁷ M−1⋅s−1, calculated according to Eq. 1. (Inset) Time course of compound I formation by the reaction of HRP (10 μM) with peroxynitrite (0.4 μM) in the absence or presence of increasing concentrations of reduced Ohr. (C) Peroxynitrite (0.5 μM) was mixed with reduced MtAhpE (2.5 μM) in the absence or presence of increasing concentrations of reduced XfOhr, and MtAhpE oxidation was followed by its total intrinsic fluorescence decrease (λ = 295 nm).
Fig. 6.
Fig. 6.
Susceptibility of ∆ohr P. aeruginosa strain to various hydroperoxides. The MIC assay was performed to assess the sensitivities of P. aeruginosa strains to distinct hydroperoxides: pUCp18 Ø is an empty vector, and pUCp18 ohr is a vector for expression of ohr from P. aeruginosa. The concentrations of hydroperoxides used are described above each panel. Plates were incubated at 37 °C under agitation (200 rpm), and the results were observed after 16 h. MIC assays were done in biological triplicates, each one with two technical replicates. All hydroperoxides were dissolved in DMSO, with the exception of ChOOH, which was dissolved in isopropyl alcohol. As control experiments, the same assays were performed with 5% DMSO or 5% isopropyl alcohol only or with the respective fatty acid or cholesterol dissolved in DMSO and isopropyl alcohol, respectively, and no loss of viability were observed. Wt, wild type.
Fig. S7.
Fig. S7.
Response of ohr mutant of P. aeruginosa to oleic acid (A), linoleic acid (B), and cholesterol (C). Wt, wild type. These experiments are the controls for the MIC assay depicted in Fig. 6, using parental fatty acids. All lipids were dissolved in 5% DMSO, with exception of cholesterol, which was dissolved in 5% isopropyl alcohol. (DF) Effect of 3-ATZ treatment on response of wild-type (WT) and single-mutant P. aeruginosa cells (Δohr, ΔahpC1, Δtpx, and Δgpx) toward H2O2 challenge. WT denotes the PA14 wild-type strain, pUCp18 Ø denotes the empty pUC18 plasmid, and pUCp18 ohr denotes the plasmid with the ohr gene. Plates were incubated at 37 °C under agitation (200 rpm), and the results were observed after 16 h. MIC assays were done in biological triplicates, each one with two technical replicates. The concentrations of H2O2 used are described above the panels.
Fig. 7.
Fig. 7.
Response of P. aeruginosa to LAOOH and peroxynitrite. pUCp18 Ø is an empty vector, and pUCp18 ohr, ahpC1, tpx, and gpx from P. aeruginosa are vectors for ohr, ahpC1, tpx, and gpx expression, respectively. (A and B) MIC assay to assess the sensitivities of P. aeruginosa strains deficient for Cys-based peroxidases to LAOOH. (C, Upper) Western blot for Ohr expression in P. aeruginosa using an antibody against Ohr from X. fastidiosa. (C, Lower) Ponceau S was used as a loading control. Cells were exposed to SIN-1 (1 mM), DMSO (5%), LAOOH (50 μM), t-BHP (200 μM), and MeOH (5%) for 30 min at 37 °C. WT, wild type. (D) Colony count assay to assess the sensitivities of P. aeruginosa strains to SIN-1 (3 mM). In all cases, cells were treated with ATZ (5 mM), a catalase inhibitor, 10 min before cells were challenged with SIN-1 (3 mM) for 30 min at 37 °C. The bars represent the means of the colony formation unit (c.f.u.) percentage relative to the sensitivity of cells treated with DMSO (5%) + 3-ATZ (5 mM) plus SD. The Δohr mutant was statistically more sensitive than the wild-type strain (**P < 0.05, unpaired t test; n = 8). WT, wild type.
Fig. S8.
Fig. S8.
P. aeruginosa response to peroxides. (A) Control of expression of AhpC1, AhpC2, Tpx, and Gpx in Δohr background. All expressed proteins shown here were tagged with human influenza hemagglutinin (HA), which allowed us to check their expression. These strains were used in the assays shown in Fig. 7A. (B) Whole membrane from experiment depicted in Fig. 6C. Because Ohr proteins present high structural conservation, rabbit polyclonal serum raised against Ohr from X. fastidiosa was able to detect PaOhr in P. aeruginosa extracts. The nonspecific bands detected here are an inherent characteristic of polyclonal sera and were also detected in the Δohr background. (C) Catalase inhibitor (ATZ) did not affect the sensitivity of the wild-type strain to SIN-1 treatment (white and gray bars). In the same way, the ΔahpC mutant did not present sensibility to SIN-1 even in the presence of 3-ATZ (n = 7 for each tested strain). For catalase inhibition, 3-ATZ (5 mM) was added 10 min before cells were challenged with SIN-1 (3 mM) for 30 min at 37 °C. (D) The Δohr mutant was not statistically more sensitive than wild-type strain to the SIN-1 (3 mM) treatment (P < 0.05, unpaired t test; n = 7). Bars represent the means of colony formation unit (c.f.u.) percentages relative to the sensitivity of cells treated with DMSO (5%) plus SD.

References

    1. Flohé L. The impact of thiol peroxidases on redox regulation. Free Radic Res. 2016;50(2):126–142. - PubMed
    1. Rhee SG, Woo HA, Kil IS, Bae SH. Peroxiredoxin functions as a peroxidase and a regulator and sensor of local peroxides. J Biol Chem. 2012;287(7):4403–4410. - PMC - PubMed
    1. Winterbourn CC, Hampton MB. Thiol chemistry and specificity in redox signaling. Free Radic Biol Med. 2008;45(5):549–561. - PubMed
    1. Peskin AV, et al. The high reactivity of peroxiredoxin 2 with H2O2 is not reflected in its reaction with other oxidants and thiol reagents. J Biol Chem. 2007;282(16):11885–11892. - PubMed
    1. Hall A, Parsonage D, Poole LB, Karplus PA. Structural evidence that peroxiredoxin catalytic power is based on transition-state stabilization. J Mol Biol. 2010;402(1):194–209. - PMC - PubMed

Publication types

MeSH terms

LinkOut - more resources