. 2017 Jan 31;114(5):1165-1170.
doi: 10.1073/pnas.1522872114. Epub 2016 Dec 27.

Nrf2 mitigates LRRK2- and α-synuclein-induced neurodegeneration by modulating proteostasis

Affiliations

Nrf2 mitigates LRRK2- and α-synuclein-induced neurodegeneration by modulating proteostasis

Gaia Skibinski et al. Proc Natl Acad Sci U S A. .

Abstract

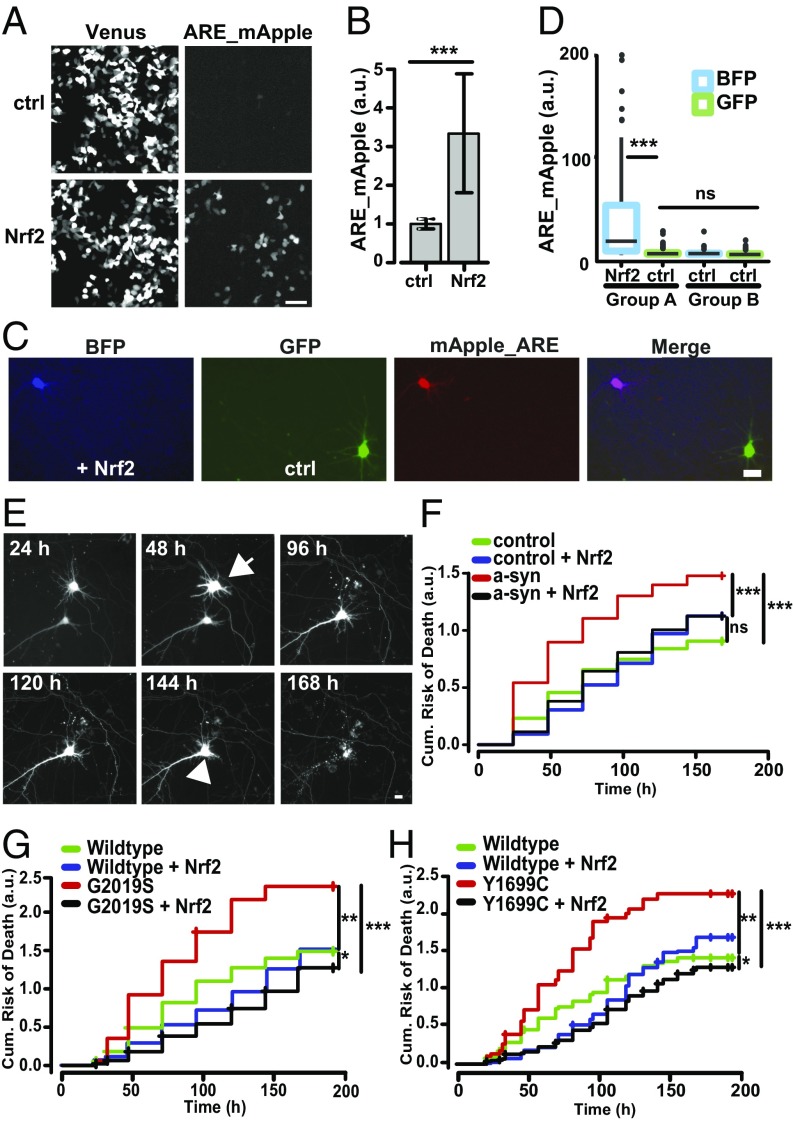
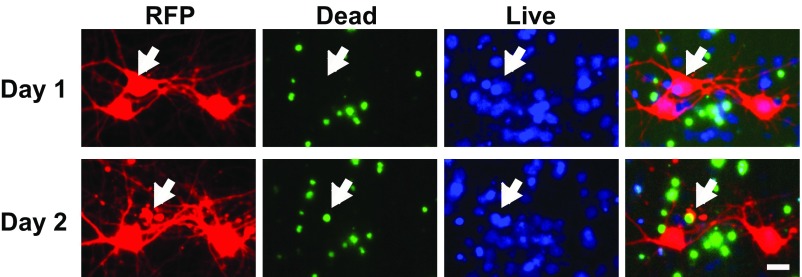
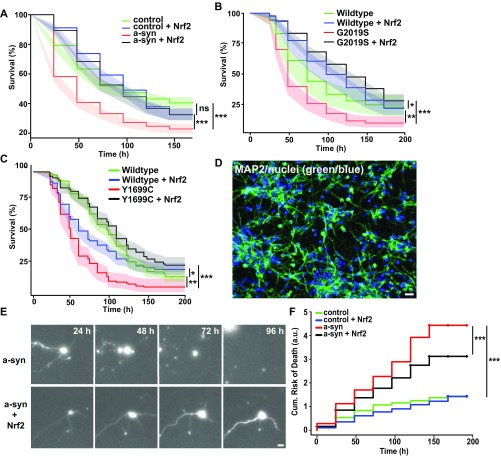
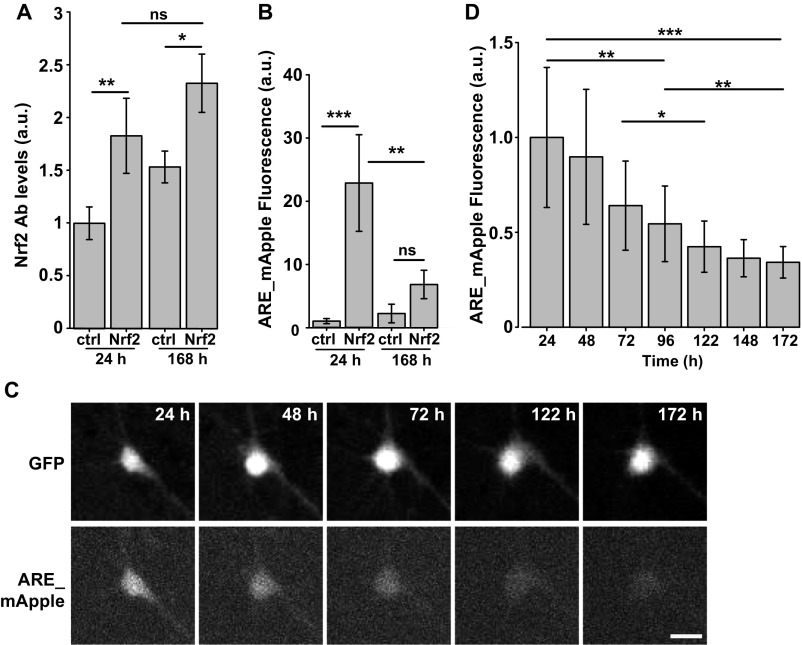
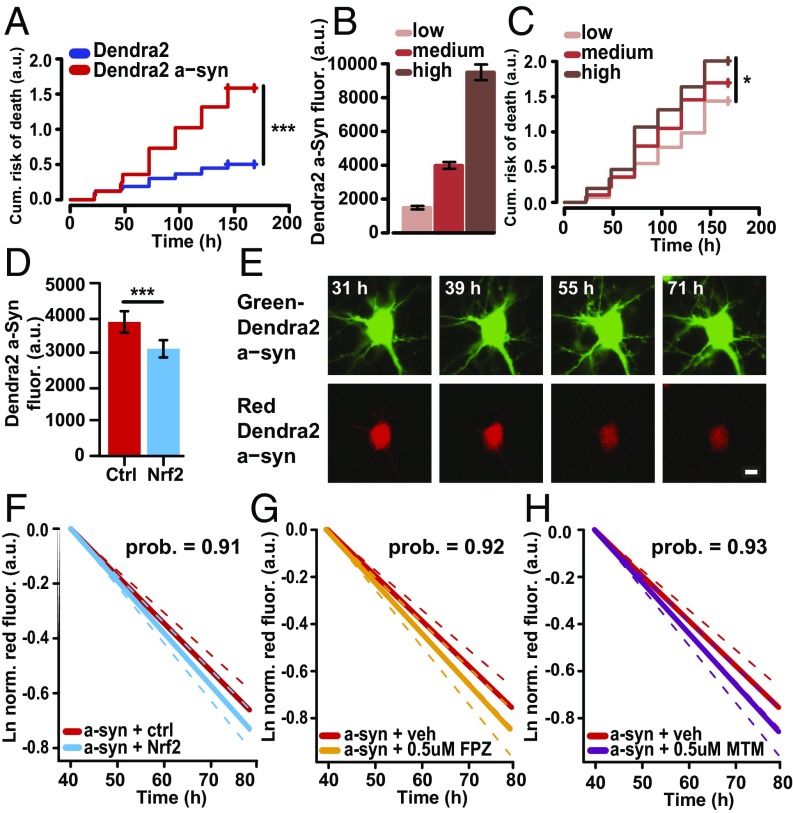
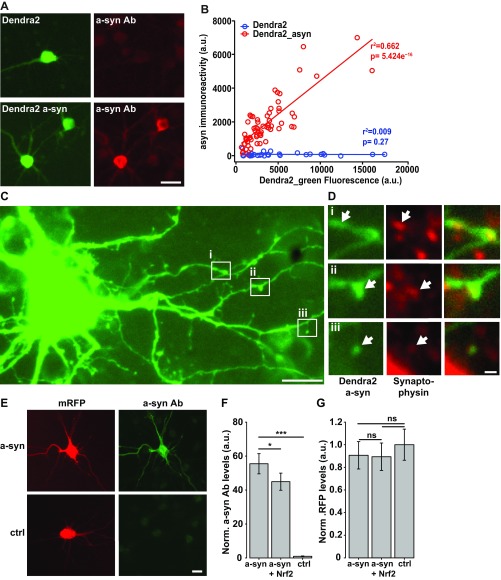
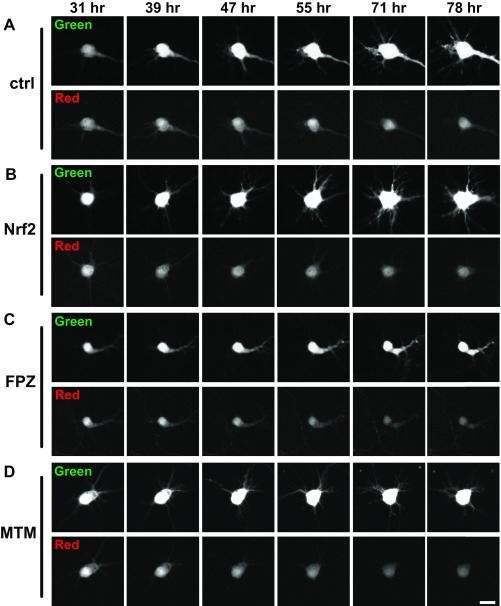
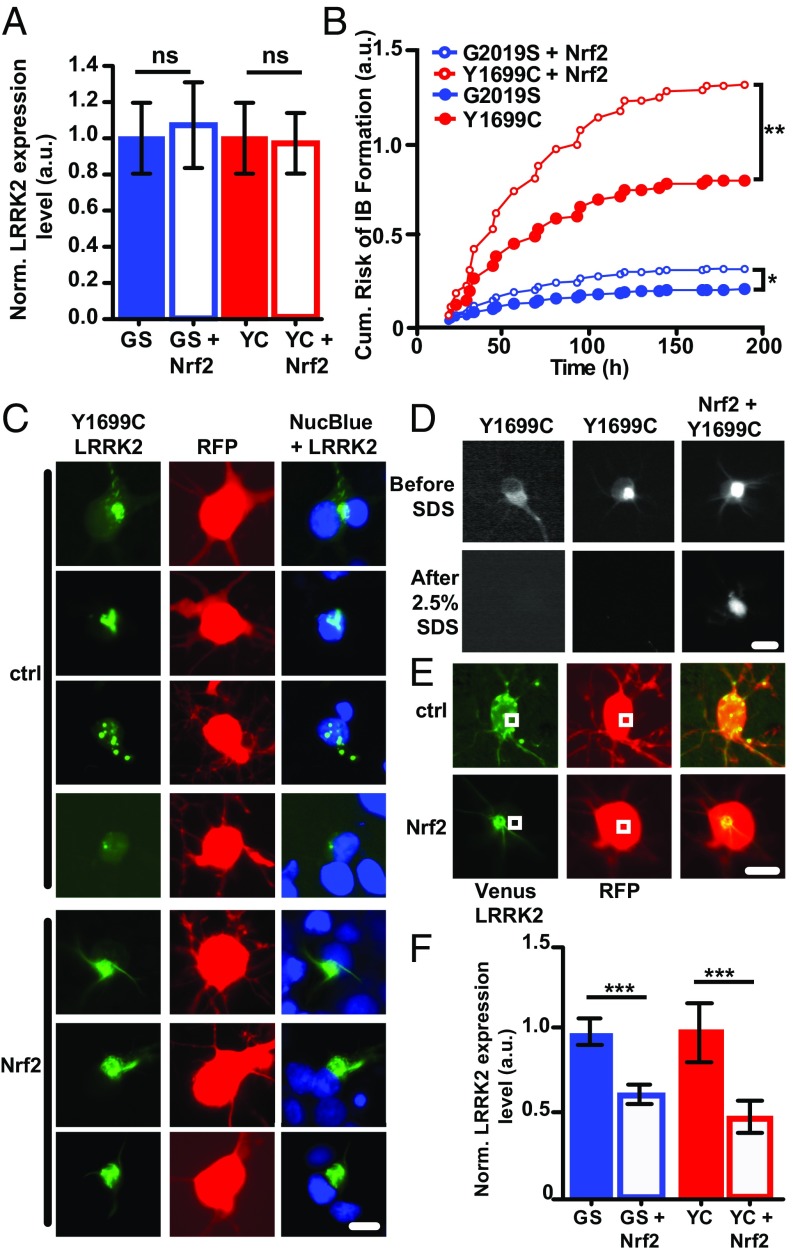
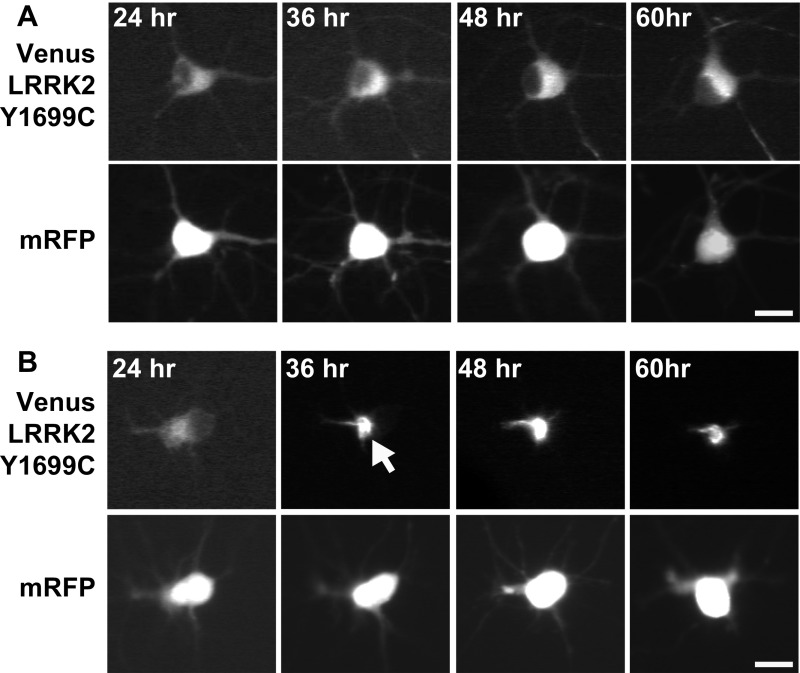
Mutations in leucine-rich repeat kinase 2 (LRRK2) and α-synuclein lead to Parkinson's disease (PD). Disruption of protein homeostasis is an emerging theme in PD pathogenesis, making mechanisms to reduce the accumulation of misfolded proteins an attractive therapeutic strategy. We determined if activating nuclear factor erythroid 2-related factor (Nrf2), a potential therapeutic target for neurodegeneration, could reduce PD-associated neuron toxicity by modulating the protein homeostasis network. Using a longitudinal imaging platform, we visualized the metabolism and location of mutant LRRK2 and α-synuclein in living neurons at the single-cell level. Nrf2 reduced PD-associated protein toxicity by a cell-autonomous mechanism that was time-dependent. Furthermore, Nrf2 activated distinct mechanisms to handle different misfolded proteins. Nrf2 decreased steady-state levels of α-synuclein in part by increasing α-synuclein degradation. In contrast, Nrf2 sequestered misfolded diffuse LRRK2 into more insoluble and homogeneous inclusion bodies. By identifying the stress response strategies activated by Nrf2, we also highlight endogenous coping responses that might be therapeutically bolstered to treat PD.

Keywords: LRRK2; Nrf2; Parkinson’s disease; proteostasis; α-synuclein.


Conflict of interest statement

The authors declare no conflict of interest.

Figures

Fig. 1.
Fig. 1.
Nrf2 activates ARE-dependent transcription in neurons and blocks degeneration caused by α-synuclein and mutant LRRK2. (A) HEK293 cells cotransfected with Venus and ARE-Apple. (Scale bar, 70 μm.) (B) Nrf2 overexpression up-regulated the ARE reporter, as measured by red fluorescence. Number of cells were as follows: control (ctrl) = 1,499; Nrf2 = 1,529. F value = 135.8, df = 1; ***P < 0.0001; 95% confidence intervals (CIs). (C) Neurons were sequentially transfected with pTag_BFP and Nrf2 (BFP, +Nrf2), followed by GFP and control plasmid (GFP, +ctrl). Both cohorts of neurons were also cotransfected with ARE_mApple. (Scale bar, 10 μm.) (D) Only neurons overexpressing Nrf2 showed a significant up-regulation of ARE_mApple expression (group A, BFP Nrf2). Neurons with GFP and control plasmid (group A, GFP ctrl) had a similar level of ARE activation as a population of neurons with no ectopic Nrf2 expression (group B). Number of cells were as follows—group A, BFP Nrf2 = 58, GFP ctrl = 137; group B, BFP ctrl = 51, GFP ctrl = 102. F value = 19.66, df = 3; ***P < 0e−10; ns, not significant; 95% CIs. (E) Images of two longitudinally tracked neurons expressing mRFP and α-synuclein. One neuron underwent neurite degeneration at 48–96 h (arrow); the other remains alive up until 144 h (arrow head). (Scale bar, 10 µm.) (F) Cumulative risk-of-death curves demonstrate that Nrf2 significantly reduced toxicity in neurons expressing α-synuclein. Number of neurons in α-synuclein = 640, α-synuclein + Nrf2 = 563, Control = 663, and Control + Nrf2 = 518. ***P < 0e−10; ns, not significant. (G and H) Cumulative risk-of-death curves demonstrate that Nrf2 significantly reduced toxicity in neurons expressing mutant G2019S LRRK2 or Y1699C LRRK2. (G) Number of neurons for wild-type LRRK2 = 97, wild-type LRRK2 + Nrf2 = 165, G2019S LRRK2 = 171, and G2019S LRRK2 + Nrf2 = 319. *P = 0.01, **P = 0.0004, ***P < 0e−10. (H) Number of neurons for wild-type LRRK2 = 366, wild-type LRRK2 + Nrf2 = 304, Y1699C LRRK2 = 139, and Y1699C LRRK2 + Nrf2 = 260. *P = 5.42e−6, **P = 0.00014, ***P < 0e−14.
Fig. S1.
Fig. S1.
(A) HEK293 cells transfected with the ARE reporter show an increase in ARE_mApple fluorescence 24 h after treatment with increasing doses of tBHQ. Fold induction is normalized to control. Mean ± 95% CIs, calculated from three independent experiments. Number of cells in each group was >1,200; F value = 935.5, df = 4. *P = 0.011, ***P < 0.0001. (B) Primary rat neurons transfected with ARE show an increase in ARE_mApple fluorescence 24 h after treatment with tBHQ. Mean ± 95% CIs, calculated from three independent experiments. Number of neurons in each group was >780; F value = 1,477, df = 3. ***P < 0.0001.
Fig. S2.
Fig. S2.
(A and B) Primary rodent neurons were cotransfected with mApple and either Nrf2 or control plasmid, fixed 24 h posttransfection, and stained for proteasome 20s alpha (Pro20s) and GST (GST). Neurons transfected with Nrf2 expressed Pro20s and GST at significantly higher levels (arrows). (Scale bar, 10 μm.) (C and D) Fold increase is normalized to the mean of the control at 24 h posttransfection, ± 95% CIs. For Pro20s, the number of cells for control = 23 and Nrf2 = 22; t = –2.77; *P = 0.01. For GST, the number of cells for control = 22 and Nrf2 = 17; t = –2.61; *P = 0.015.
Fig. S3.
Fig. S3.
Primary neurons transfected with mRFP were followed for 7 d using longitudinal imaging. The mRFP signal steadily increases in a population of neurons over the course of the experiment. Time-specific fluorescence changes in neurons were statistically tested with the generalized estimating equations using the geese function in the geepack R package. Differences in mean fluorescence at select time points were tested using the contrast function in the contrast R package. P values were adjusted for multiple comparisons using the Holm correction method. Number of neurons at 24 h = 523. *P = 8.1e−4, **P < 1.8e−5, ***P < 0e−14; ns, nonsignificant.
Fig. S4.
Fig. S4.
Loss of red fluorescent signal corresponds with cell death. Primary neurons were transfected with an RFP and treated with a live dead stain (ReadyProbes Cell Viability, ThermoFisher) 72 h later. The “live” blue stain indicates the health of the cell on day 1. In contrast, the loss of the red fluorescence signal is associated with the appearance of a green “dead” stain on day 2. (Scale bar, 10 μm.)
Fig. S5.
Fig. S5.
Kaplan–Meier survival functions with 95% CIs for survival at any particular time point demonstrate that overexpressing Nrf2 significantly reduced toxicity in neurons expressing mutant (A) α-synuclein, (B) Venus-G2019S-LRRK2, or (C) Venus-Y1699C-LRRK2. Number of neurons and P values are the same as those described in Fig. 1 F–H. (D) Representative image from immunocytochemistry of human neurons differentiated from iPSCs from a control individual, costained with MAP2 and DAPI. Approximately 75% of cells are MAP2-positive. (Scale bar, 40 µm.) (E) Longitudinal imaging of human neurons expressing GFP_synapsin and α-synuclein and either Nrf2 or control plasmid. The neuron in the Top panels dies between 24 and 48 h, whereas the neuron in the Bottom panels expresses Nrf2 and lives to at least 96 h. (Scale bar, 10 µm.) (F) Cumulative risk of death curves demonstrate that Nrf2 significantly reduced toxicity in neurons expressing mutant α-synuclein. Number of neurons for control = 188, control + Nrf2 = 201, α-synuclein = 252, and α-synuclein + Nrf2 = 280. **P = 0.00071, ***P = 1.11e−16; ns, nonsignificant.
Fig. S6.
Fig. S6.
(A) Primary rodent neurons cotransfected with GFP and either Nrf2 or control plasmid showed no significant difference in Nrf2 levels at 24 or 168 h posttransfection after fixing and staining for Nrf2. Fold increase is normalized to control at 24 h posttransfection. Mean ± 95% CIs. Number of cells in each group was between 30 and 49; F value = 7.753, df = 3. *P = 0.01, **P = 0.03; ns, not significant. (B) Primary rodent neurons cotransfected with GFP, ARE_mApple, and either Nrf2 or control plasmid showed a significant difference in ARE_mApple fluorescence in neurons at 24 or 168 h posttransfection. Fold increase is normalized to control at 24 h posttransfection. Mean ± 95% CIs. Number of cells in each group was between 30 and 53; F value = 10.76, df = 3. **P = 0.006, ***P < 6.1e−6; ns, not significant. (C) Representative images of primary rodent neurons cotransfected with GFP, ARE_mApple, and either Nrf2 or control plasmid and imaged for 7 d. (Scale bar, 10 μm.) (D) Neurons that lived up to 7 d were measured for ARE_mApple fluorescence on each day and showed a time-dependent decrease in ARE_mApple fluorescence. Fold increase is normalized to control at 24 h posttransfection. Mean ± 95% CIs. Time-specific fluorescence changes in neurons were statistically tested with the generalized estimating equations using the geese function in the geepack R package. Differences in mean fluorescence at select time points were tested using the contrast function in the contrast R package. P values were adjusted for multiple comparisons using the Holm correction method. Number of cells was 63. *P = 0.0021, **P < 1.2e−4, ***P = 3.3e−7.
Fig. 2.
Fig. 2.
Nrf2 decreases α-synuclein levels by increasing its degradation. (A) Overexpression of Dendra2–α-synuclein in neurons leads to an increased risk of death. Number of neurons: Dendra2 = 238, Dendra2–α-synuclein = 239; HR, 2.86; ***P < 0.0001. (B) Neurons expressing Dendra2–α-synuclein were separated into low-, medium-, or high-expressing neurons. (C) Neurons in the highest tercile of Dendra2–α-synuclein expression displayed higher risk of death than neurons in the lowest tercile of Dendra2–α-synuclein expression. Number of neurons in low = 59, medium = 60, and high = 67; HR, 1.54; low versus high *P = 0.03. (D) Steady-state levels of α-synuclein are lower in neurons expressing Nrf2. Number of neurons for ctrl = 139, Nrf2 = 96; t test, F value = 16.01; ***P < 0.0001. (E) A neuron transfected with Dendra2–α-synuclein was pulsed for 1–2 s with 405-nm light and imaged for several days. (Scale bar, 10 μm.) (F) Neurons expressing Nrf2 had a 10% increase in Dendra2–α-synuclein degradation. The mean slopes were –0.019 (95% CI –0.021, –0.017) and –0.0173 (95% CI, –0.019, –0.015) for Nrf2 and control cells, respectively. The posterior probability for a steeper mean slope of RFP fluorescence in Nrf2 cells was 0.91, indicating that it is overwhelmingly likely that the degradation of Dendra2–α-synuclein was faster in cells with Nrf2. Number of neurons, Dendra2–α-synuclein/Ctrl = 400 and Dendra2–α-synuclein/Nrf2 = 377. (G and H) Neurons transfected with Dendra2–α-synuclein and exposed to 0.5 µM fluphenazine (FPZ) or 0.5 µM methotrimeprazine (MTM) show a 24% (posterior probability, 0.92) and 23% (posterior probability, 0.93) faster degradation of α-synuclein, respectively, compared with vehicle control (DMSO). The mean slopes for RFP fluorescence were –0.0192 (CI, –0.021, –0.017), –0.0216 (CI, –0.024 to 0.019), and –0.0218 (CI, –0.024 to 0.019) for neurons treated with vehicle (veh), 0.5 µM FPZ, and 0.5 µM MTM, respectively. Number of neurons in veh = 490, FPZ = 337, and MTM = 340.
Fig. S7.
Fig. S7.
(A) Primary rodent neurons transfected with Dendra2–α-synuclein or Dendra2 were fixed 48 h after transfection and immunostained with antibodies against α-synuclein. (Scale bar, 20 μm.) (B) Neuron-by-neuron comparison of α-synuclein levels, estimated by measuring Dendra2_GFP fluorescence directly and by measuring immunoreactivity against α-synuclein. Measurements of α-synuclein from neurons transfected with the Dendra2–α-synuclein fusion protein are highly correlated to the fluorescence of the Dendra2 tag. The immunoreactivity is specific to α-synuclein because there is no significant immunoreactivity in neurons transfected with Dendra2 alone. (C and D) Primary rodent neurons were cotransfected with Dendra2–α-synuclein at 11 DIV and fixed 48 h posttransfection and stained with a synaptophysin antibody. Dendra2–α-synuclein is expressed throughout the cell body and the neuritic arbor of the neuron including to (D) synaptophysin positive puncta (arrows). [Scale bars, (C) 10 μm and (D) 1 μm.] (E) Primary rodent neurons cotransfected with mRFP, α-synuclein, and either Nrf2 or control plasmid were fixed 24 h posttransfection and immunostained with α-synuclein. (Scale bar, 10 μm.) (F) Levels of α-synuclein fluorescence were significantly lower in neurons transfected with Nrf2 compared with control. Fold increase is normalized to control mean ± 95% CIs. Number of cells in each group was between 47 and 111; F value = 173.4, df = 2. *P = 0.015, ***P < 0e−7. (G) Levels of red fluorescence were similar in neurons transfected with Nrf2 or control. Fold increase is normalized to the mean of the control at 24 h posttransfection ± 95% CIs. Number of cells in each group was between 47 and 111; F value = 0.653, df = 3. ns, not significant.
Fig. S8.
Fig. S8.
Representative images of automated fluorescence microscopy and optical pulse labeling of primary cortical neurons transfected with Dendra2–α-synuclein. Neurons were cotransfected with (A) control (ctrl), (B) Nrf2, or (C and D) treated with autophagy inducers FPZ or MTM. After a 1–2-s pulse of 405-nm light, a portion of Dendra2–α-synuclein was converted from a green to red fluorescent state, and individual neurons were imaged for several days by longitudinal fluorescence microscopy. (Scale bar, 10 μM.)
Fig. 3.
Fig. 3.
Nrf2 increases LRRK2 IB formation and insolubility. (A) At 24 h posttransfection, levels of G2019S-LRRK2 and Y1699C-LRRK2 were unchanged in the presence of Nrf2. Number of neurons per group for G2019S (GS) = 200, GS + Nrf2 = 316, Y1699C (YC) = 128, and YC + Nrf2 = 247; 95% CIs. ns, not significant. (B) Nrf2 increases the cumulative risk of IB formation in neurons expressing G2019S-LRRK2 and Y1699C-LRRK2. *P < 0.01, **P < 0.001. (C) Representative images of neurons expressing Y1699C-LRRK2, mRFP, and either Nrf2 or empty vector control at 48–72 h posttransfection. Neurons were treated with NucBlue to label the nuclei. Neurons expressing Nrf2 form more homogeneous, perinuclear, and compact IBs. (Scale bar, 10 µm.) (D) A detergent resistance assay shows that, in the presence of Nrf2, G2019S-LRRK2 IBs are resistant to SDS/Triton X-100 treatment. (Scale bar, 10 µm.) (E) Representative images of neurons cotransfected with Y1699C-LRRK2, RFP, and either Nrf2 or control plasmid at 32–45 h posttransfection. Neurons with IBs were measured for diffuse levels of Venus-LRRK2 elsewhere in the cell (white boxes). (Scale bar, 10 µm.) (F) Neurons that form IBs by 32 h posttransfection in the presence of Nrf2 have significantly lower levels of cytoplasmic diffuse G2019S-LRRK2 and Y1699C-LRRK2 than neurons with no Nrf2. Number of cells per group were GS = 26, GS + Nrf2 = 27, YC = 52, and YC + Nrf2 = 68; 95% CIs; t test; F values 14.93 (G2019S) and 18.08 (Y1699C). ***P = 0.00038 (G2019S) and P = 4.46e−0.5 (Y1699C).
Fig. S9.
Fig. S9.
Primary rodent neurons were cotransfected with mRFP, Venus-Y1699C-LRRK2, and either Nrf2 or control plasmid and imaged longitudinally. (A) Representative images of a neuron expressing the diffuse form of Venus-Y1699C-LRRK2 at several time points up to 60 h posttransfection. (B) In contrast, representative images of a neuron that is diffuse at 24 h posttransfection but forms a Venus-Y1699C-LRRK2 IB at 36 h posttransfection (arrow). (Scale bar, 10 μm.)

Comment in

References

    1. Polymeropoulos MH, et al. Mutation in the alpha-synuclein gene identified in families with Parkinson’s disease. Science. 1997;276(5321):2045–2047. - PubMed
    1. Paisán-Ruíz C, et al. Cloning of the gene containing mutations that cause PARK8-linked Parkinson’s disease. Neuron. 2004;44(4):595–600. - PubMed
    1. Clark LN, et al. Frequency of LRRK2 mutations in early- and late-onset Parkinson disease. Neurology. 2006;67(10):1786–1791. - PubMed
    1. Spillantini MG, Crowther RA, Jakes R, Hasegawa M, Goedert M. alpha-Synuclein in filamentous inclusions of Lewy bodies from Parkinson’s disease and dementia with Lewy bodies. Proc Natl Acad Sci USA. 1998;95(11):6469–6473. - PMC - PubMed
    1. Skibinski G, Nakamura K, Cookson MR, Finkbeiner S. Mutant LRRK2 toxicity in neurons depends on LRRK2 levels and synuclein but not kinase activity or inclusion bodies. J Neurosci. 2014;34(2):418–433. - PMC - PubMed

Publication types

MeSH terms