

Network-based analysis of differentially expressed genes in cerebrospinal fluid (CSF) and blood reveals new candidate genes for multiple sclerosis
- PMID: 28028462
- PMCID: PMC5183126
- DOI: 10.7717/peerj.2775
Network-based analysis of differentially expressed genes in cerebrospinal fluid (CSF) and blood reveals new candidate genes for multiple sclerosis
Abstract
Background: The involvement of multiple genes and missing heritability, which are dominant in complex diseases such as multiple sclerosis (MS), entail using network biology to better elucidate their molecular basis and genetic factors. We therefore aimed to integrate interactome (protein-protein interaction (PPI)) and transcriptomes data to construct and analyze PPI networks for MS disease.
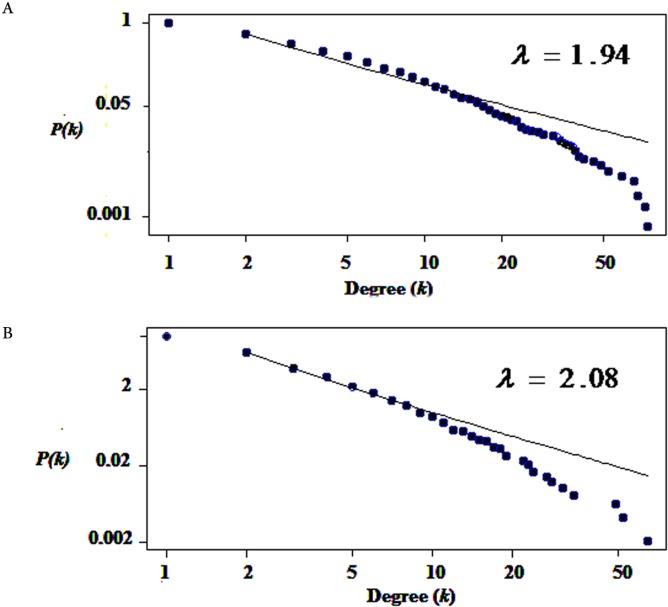
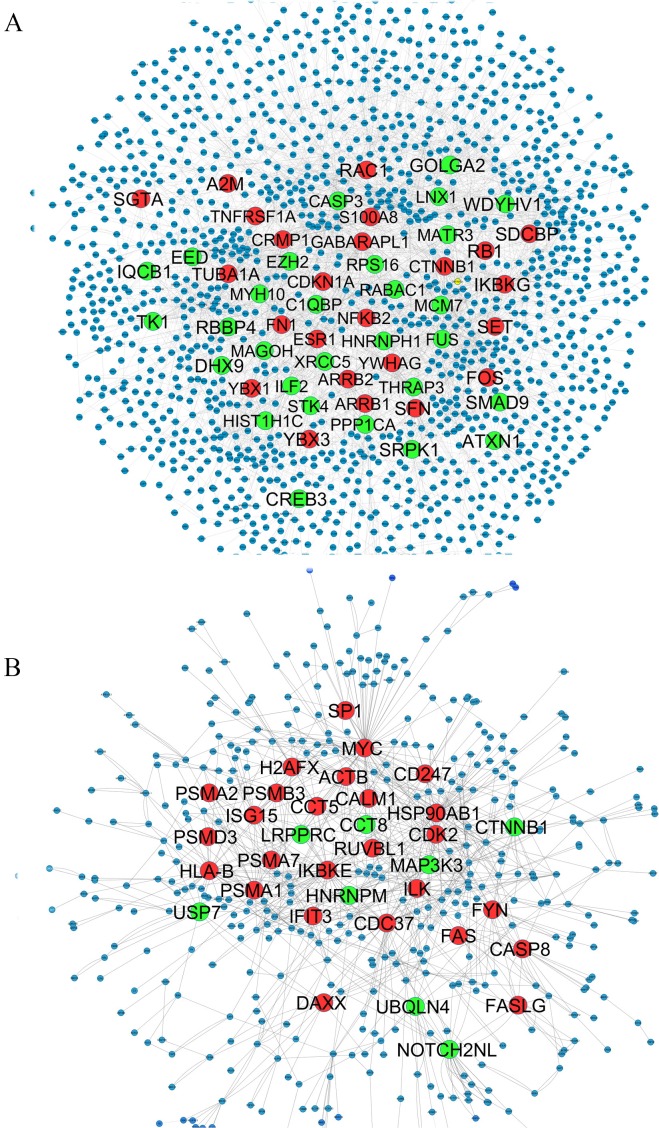
Methods: Gene expression profiles in paired cerebrospinal fluid (CSF) and peripheral blood mononuclear cells (PBMCs) samples from MS patients, sampled in relapse or remission and controls, were analyzed. Differentially expressed genes which determined only in CSF (MS vs. control) and PBMCs (relapse vs. remission) separately integrated with PPI data to construct the Query-Query PPI (QQPPI) networks. The networks were further analyzed to investigate more central genes, functional modules and complexes involved in MS progression.
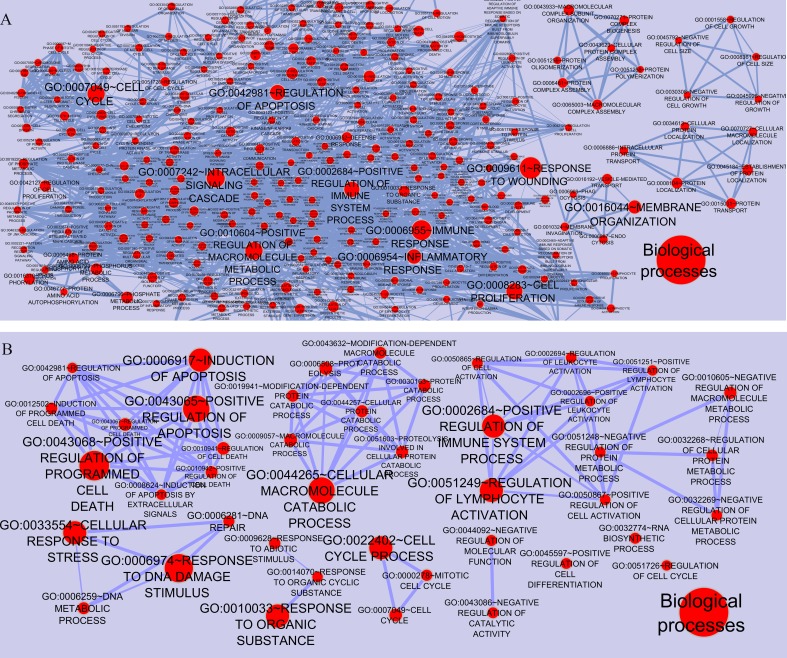
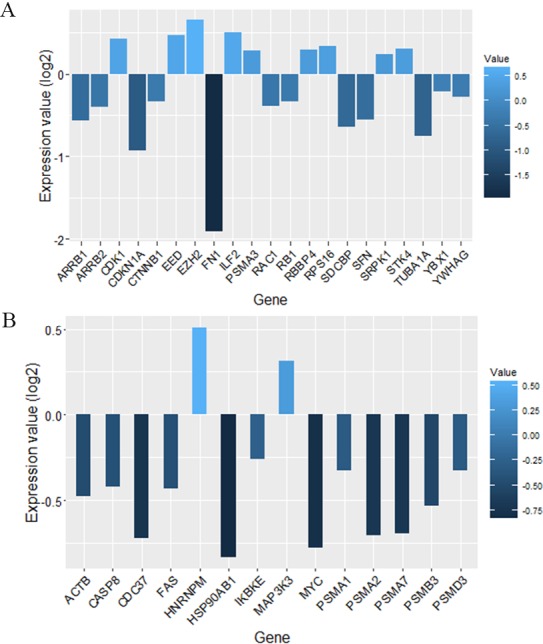
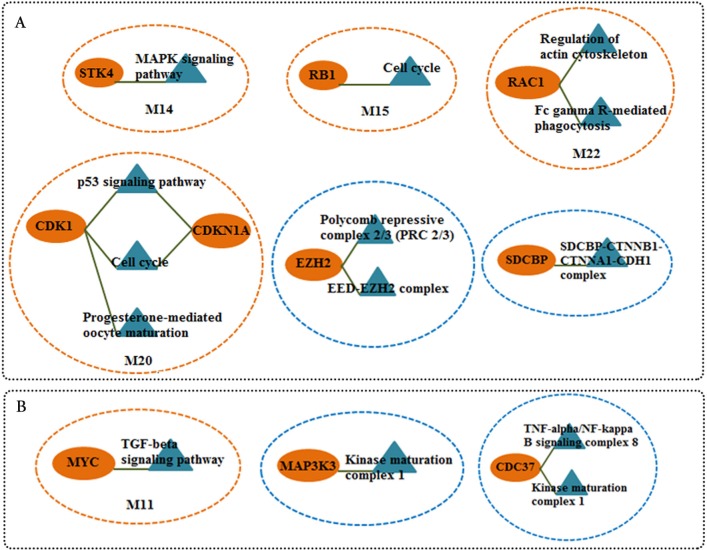
Results: The networks were analyzed and high centrality genes were identified. Exploration of functional modules and complexes showed that the majority of high centrality genes incorporated in biological pathways driving MS pathogenesis. Proteasome and spliceosome were also noticeable in enriched pathways in PBMCs (relapse vs. remission) which were identified by both modularity and clique analyses. Finally, STK4, RB1, CDKN1A, CDK1, RAC1, EZH2, SDCBP genes in CSF (MS vs. control) and CDC37, MAP3K3, MYC genes in PBMCs (relapse vs. remission) were identified as potential candidate genes for MS, which were the more central genes involved in biological pathways.
Discussion: This study showed that network-based analysis could explicate the complex interplay between biological processes underlying MS. Furthermore, an experimental validation of candidate genes can lead to identification of potential therapeutic targets.
Keywords: Clique analysis; Modularity; Multiple sclerosis; Protein–protein interaction network (PPIN); Topology; Transcriptome.
Conflict of interest statement
The authors declare there are no competing interests.
Figures
Similar articles
-
Identification of common key genes and pathways between type 1 diabetes and multiple sclerosis using transcriptome and interactome analysis.Endocrine. 2020 Apr;68(1):81-92. doi: 10.1007/s12020-019-02181-8. Epub 2020 Jan 7. Endocrine. 2020. PMID: 31912409
-
Identification of new key genes for type 1 diabetes through construction and analysis of protein-protein interaction networks based on blood and pancreatic islet transcriptomes.J Diabetes. 2017 Aug;9(8):764-777. doi: 10.1111/1753-0407.12483. Epub 2016 Nov 21. J Diabetes. 2017. PMID: 27625010
-
Immune and Epstein-Barr virus gene expression in cerebrospinal fluid and peripheral blood mononuclear cells from patients with relapsing-remitting multiple sclerosis.J Neuroinflammation. 2015 Jul 14;12:132. doi: 10.1186/s12974-015-0353-1. J Neuroinflammation. 2015. PMID: 26169064 Free PMC article.
-
[Molecular biomarkers for prediction of multiple sclerosis relapse].Nihon Rinsho. 2008 Jun;66(6):1103-11. Nihon Rinsho. 2008. PMID: 18540355 Review. Japanese.
-
Insights into the human brain proteome: Disclosing the biological meaning of protein networks in cerebrospinal fluid.Crit Rev Clin Lab Sci. 2017 May;54(3):185-204. doi: 10.1080/10408363.2017.1299682. Epub 2017 Apr 10. Crit Rev Clin Lab Sci. 2017. PMID: 28393582 Review.
Cited by
-
Gene network reveals LASP1, TUBA1C, and S100A6 are likely playing regulatory roles in multiple sclerosis.Front Neurol. 2023 Mar 9;14:1090631. doi: 10.3389/fneur.2023.1090631. eCollection 2023. Front Neurol. 2023. PMID: 36970516 Free PMC article.
-
Protein interaction mapping interpretation of none alcoholic fatty liver disease model of rats after fat diet feeding.Gastroenterol Hepatol Bed Bench. 2017 Winter;10(Suppl1):S146-S153. Gastroenterol Hepatol Bed Bench. 2017. PMID: 29511485 Free PMC article.
-
An Integrated Bioinformatics Analysis of the Potential Regulatory Effects of miR-21 on T-cell Related Target Genes in Multiple Sclerosis.Avicenna J Med Biotechnol. 2021 Jul-Sep;13(3):149-165. doi: 10.18502/ajmb.v13i3.6364. Avicenna J Med Biotechnol. 2021. PMID: 34484645 Free PMC article.
-
Evaluation of expression of common genes in the intestine and peripheral blood mononuclear cells (PBMC) associated with celiac disease.Gastroenterol Hepatol Bed Bench. 2020 Winter;13(Suppl1):S60-S67. Gastroenterol Hepatol Bed Bench. 2020. PMID: 33585005 Free PMC article.
-
Bioinformatics Investigation and Contribution of Other Chromosomes Besides Chromosome 21 in the Risk of Down Syndrome Development.Basic Clin Neurosci. 2021 Jan-Feb;12(1):79-88. doi: 10.32598/bcn.12.1.941.6. Epub 2021 Jan 1. Basic Clin Neurosci. 2021. PMID: 33995930 Free PMC article.
References
-
- Arias CF, Ballesteros-Tato A, García MI, Martín-Caballero J, Flores JM, Martínez-A C, Balomenos D. p21CIP1/WAF1 controls proliferation of activated/memory T cells and affects homeostasis and memory T cell responses. The Journal of Immunology. 2007;178:2296–2306. doi: 10.4049/jimmunol.178.4.2296. - DOI - PubMed
LinkOut - more resources
Full Text Sources
Other Literature Sources
Research Materials
Miscellaneous
