. 2016 Dec 20;1(6):e00139-16.
doi: 10.1128/mSystems.00139-16. eCollection 2016 Nov-Dec.

Spatial Molecular Architecture of the Microbial Community of a Peltigera Lichen

Affiliations

Spatial Molecular Architecture of the Microbial Community of a Peltigera Lichen

Neha Garg et al. mSystems. .

Abstract

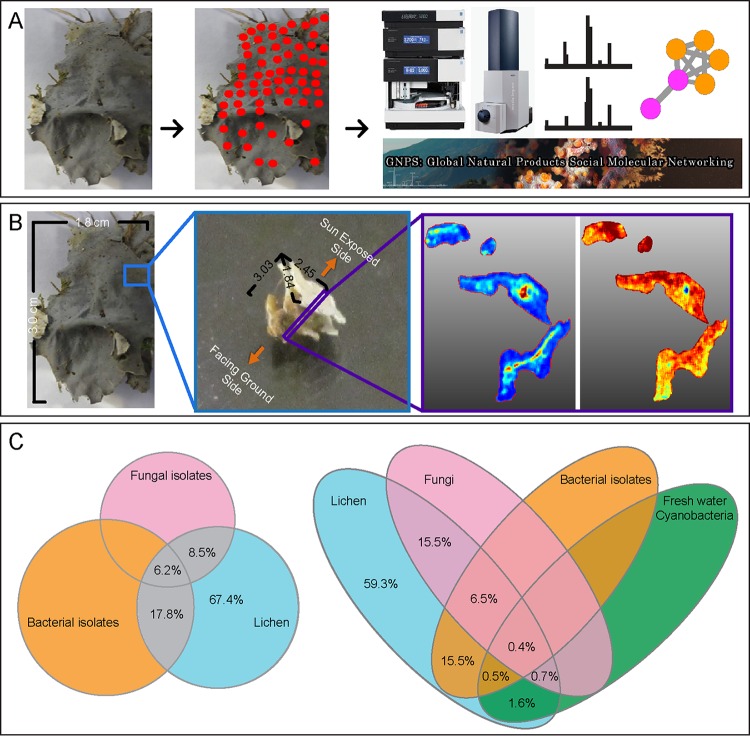
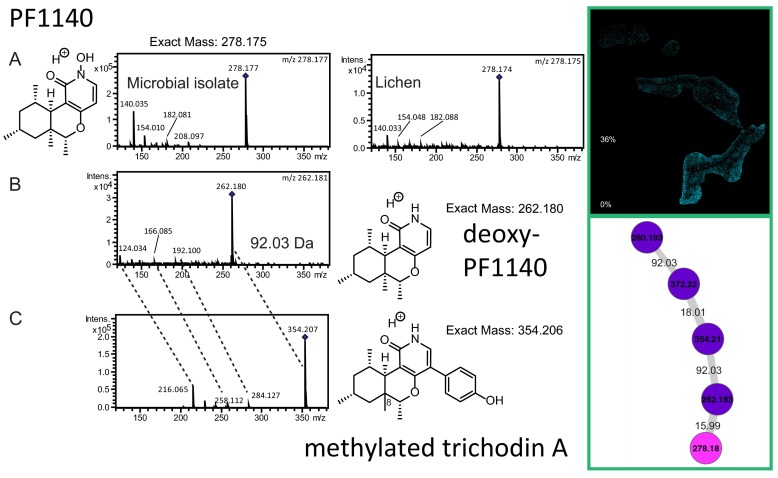
Microbes are commonly studied as individual species, but they exist as mixed assemblages in nature. At present, we know very little about the spatial organization of the molecules, including natural products that are produced within these microbial networks. Lichens represent a particularly specialized type of symbiotic microbial assemblage in which the component microorganisms exist together. These composite microbial assemblages are typically comprised of several types of microorganisms representing phylogenetically diverse life forms, including fungi, photosymbionts, bacteria, and other microbes. Here, we employed matrix-assisted laser desorption ionization-time of flight (MALDI-TOF) imaging mass spectrometry to characterize the distributions of small molecules within a Peltigera lichen. In order to probe how small molecules are organized and localized within the microbial consortium, analytes were annotated and assigned to their respective producer microorganisms using mass spectrometry-based molecular networking and metagenome sequencing. The spatial analysis of the molecules not only reveals an ordered layering of molecules within the lichen but also supports the compartmentalization of unique functions attributed to various layers. These functions include chemical defense (e.g., antibiotics), light-harvesting functions associated with the cyanobacterial outer layer (e.g., chlorophyll), energy transfer (e.g., sugars) surrounding the sun-exposed cyanobacterial layer, and carbohydrates that may serve a structural or storage function and are observed with higher intensities in the non-sun-exposed areas (e.g., complex carbohydrates). IMPORTANCE Microbial communities have evolved over centuries to live symbiotically. The direct visualization of such communities at the chemical and functional level presents a challenge. Overcoming this challenge may allow one to visualize the spatial distributions of specific molecules involved in symbiosis and to define their functional roles in shaping the community structure. In this study, we examined the diversity of microbial genes and taxa and the presence of biosynthetic gene clusters by metagenomic sequencing and the compartmentalization of organic chemical components within a lichen using mass spectrometry. This approach allowed the identification of chemically distinct sections within this composite organism. Using our multipronged approach, various fungal natural products, not previously reported from lichens, were identified and two different fungal layers were visualized at the chemical level.

Keywords: lichen; mass spectrometry; metagenomics; microbial assemblages; natural products.


Figures

FIG 1
FIG 1
(A) A needle was used to scrape off small amounts of material from 110 locations from the original piece of lichen. UHPLC-MS/MS data were acquired on these materials, and data analysis was performed using the online analysis infrastructure GNPS. (B) A 2.5-mm by 1.8-mm by 3-mm piece of lichen was sectioned from the original lichen piece (1.8 cm by 3 cm). This section was embedded in gelatin, and MALDI IMS data were acquired on three layers, the sun-exposed layer, the middle layer, and the bottom layer, to reveal metabolite distributions in false color. (C) The Venn diagram on the left shows the percentage of molecules detected in lichen that are of either fungal or bacterial origin. This Venn diagram is scaled to demonstrate the number of features detected. The origin was assigned by identifying common molecules in the MS/MS data acquired on the lichen and microbes cultured from this lichen. The Venn diagram on the right shows percentages of common molecules among lichen, cultured microbial isolates, and public data sets on soil fungi as well as freshwater cyanobacteria.
FIG 2
FIG 2
The molecular family belonging to fungal pyridone alkaloid PF1140 is shown. (A) The representative molecule PF1140 was identified in both lichen and fungal isolate (pink node) as well as in the MALDI IMS data. (B) The cultured microbes also produced a previously known analogue, deoxy-PF1140 (purple node). (C) The isolated microbe also showed production of an unknown molecule at m/z 354.207 (purple node). The shift in the parent mass for this unknown molecule by 92.03 Da from the mass of deoxy-PF1140 suggested addition of a phenol group to deoxy-PF1140. The MS/MS fragments also showed a shift of 92.03 Da in mass (shown in dashed lines). A structure search in SciFinder suggested the molecule to be a new analogue of trichodin A with one additional methyl group. The putative structures and the tandem MS spectra of other molecules in this cluster are shown in Fig. S5 in the supplemental material.
FIG 3
FIG 3
The molecular network of the fungal molecule asperphenamate (m/z 507.229) and its distribution are shown. The pink node represents a common molecule produced by both the lichen and the isolated microbe. The purple nodes are unique to the cultured microbe, and the orange node is unique to lichen. The underlying MS/MS spectra for asperphenamate in the orange node were recorded at lower intensity and also have a contaminating MS/MS spectrum from a molecule with similar mass. Hence, this node is not merged with the pink node corresponding to asperphenamate. The MS/MS spectra of asperphenamate (m/z 507.229) and the analogues (m/z 532.222 and 564.248) are annotated in the MS/MS spectra shown, and annotations are described in Text S1 in the supplemental material.
FIG 4
FIG 4
The molecular network of a family of sesquiterpene lactones and the distribution of a representative molecule with an MS/MS spectrum match to alantolactone are shown. All the labeled MS/MS peaks for alantolactone matched the MS/MS spectra available on the METLIN metabolite database. The known analogues at m/z 249.149 and 235.169 are annotated as hydroxyalantolactone and dihydroisoalantolactone based on the MS/MS data available on METLIN. The molecule at m/z 265.143 is annotated as dihydroxyalantolactone due to an increase in the parent mass of 15.99 Da from the mass of hydroxyalantolactone. The corresponding fragments with a 15.99-Da shift are labeled in the MS/MS spectra in blue. Orange represents spectra found in lichen samples only, pink represents spectra found in both lichen and cultured isolates, purple represents spectra detected only in cultured isolates, and grey nodes represent other combinations.
FIG 5
FIG 5
The MS/MS spectra and MALDI IMS distributions of mannitol and the corresponding polysaccharide containing mannitol are shown. The polysaccharide at m/z 345.138 contains an additional hexose residue, and the polysaccharide at m/z 689.272 contains two additional hexose sugar residues. The molecular network corresponding to the polysaccharide family is shown in Fig. S6B in the supplemental material.
FIG 6
FIG 6
The chlorophyll a pigments pheophytin A and pheophorbide A were identified in both UHPLC-MS/MS data and MALDI-IMS data. The two major fragments at m/z 593.276 and m/z 533.255 are annotated in the structure of pheophytin A.
FIG 7
FIG 7
The mass spectrum of heterocyst glycolipid and the corresponding structures are shown on the right. The cyanobacterial heterocyst glycolipid colocalizes with the cyanobacterial chlorophyll (Fig. 5 and 8B). The heterocyst biosynthetic gene cluster was identified by running antiSMASH on the metaSPAde assembly of the short-read data set. The gene cluster identified by using antiSMASH is shown as the query sequence, and the gene cluster previously deposited in antiSMASH corresponds to the gene cluster named BGC0000869_c1.
FIG 8
FIG 8
The distribution of fungal molecules PF1140, asperphenamate, and alantolactone (A) and cyanobacterial molecules (chlorophyll and heterocyst glycolipid) (B) and a representative member of the molecular family of compounds with spectral similarity to lupeol is shown. The complete overlap of cyanobacterial chlorophyll pigment (green) and heterocyst glycolipid (red) results in cyanobacteria appearing yellow.

References

    1. Camilli A, Bassler BL. 2006. Bacterial small-molecule signaling pathways. Science 311:1113–1116. doi: 10.1126/science.1121357. - DOI - PMC - PubMed
    1. Davies J, Ryan KS. 2012. Introducing the parvome: bioactive compounds in the microbial world. ACS Chem Biol 7:252–259. doi: 10.1021/cb200337h. - DOI - PubMed
    1. Phelan VV, Liu WT, Pogliano K, Dorrestein PC. 2011. Microbial metabolic exchange—the chemotype-to-phenotype link. Nat Chem Biol 8:26–35. doi: 10.1038/nchembio.739. - DOI - PMC - PubMed
    1. Sanchez LM, Dorrestein PC. 2013. Analytical chemistry: virulence caught green-handed. Nat Chem 5:155–157. doi: 10.1038/nchem.1583. - DOI - PMC - PubMed
    1. Yuan X, Xiao S, Taylor TN. 2005. Lichen-like symbiosis 600 million years ago. Science 308:1017–1020. doi: 10.1126/science.1111347. - DOI - PubMed