. 2017 Mar 15;595(6):2001-2019.
doi: 10.1113/JP273589. Epub 2017 Feb 22.

Rapid frequency-dependent changes in free mitochondrial calcium concentration in rat cardiac myocytes

Affiliations

Rapid frequency-dependent changes in free mitochondrial calcium concentration in rat cardiac myocytes

Rob C I Wüst et al. J Physiol. .

Abstract

Key points: Calcium ions regulate mitochondrial ATP production and contractile activity and thus play a pivotal role in matching energy supply and demand in cardiac muscle. The magnitude and kinetics of the changes in free mitochondrial calcium concentration in cardiac myocytes are largely unknown. Rapid stimulation frequency-dependent increases but relatively slow decreases in free mitochondrial calcium concentration were observed in rat cardiac myocytes. This asymmetry caused a rise in the mitochondrial calcium concentration with stimulation frequency. These results provide insight into the mechanisms of mitochondrial calcium uptake and release that are important in healthy and diseased myocardium.

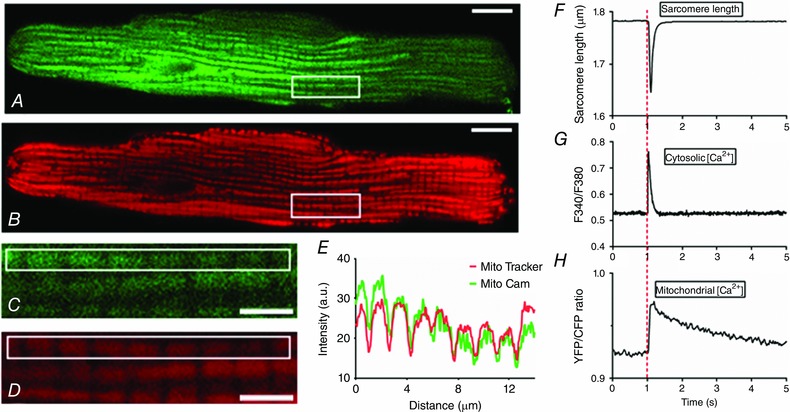
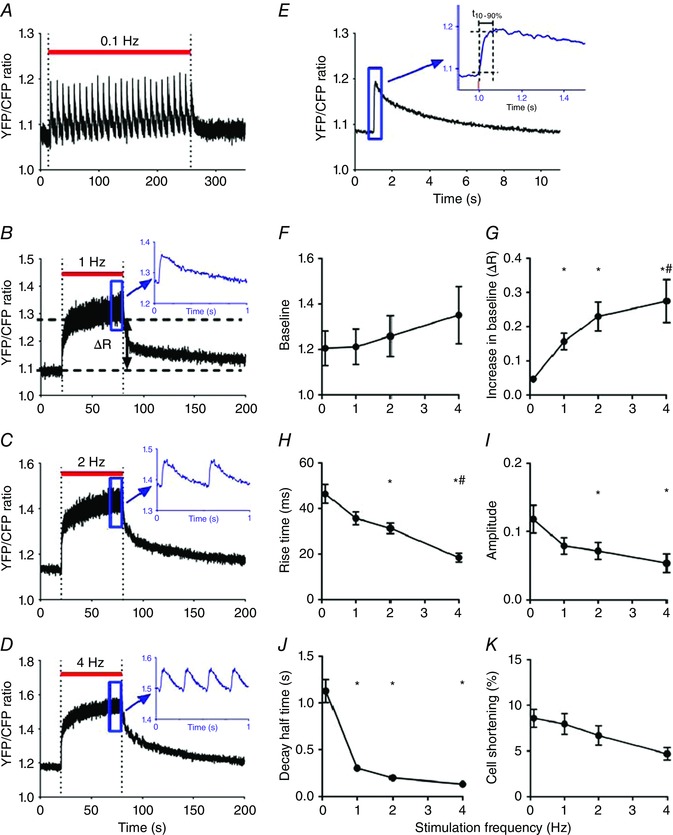
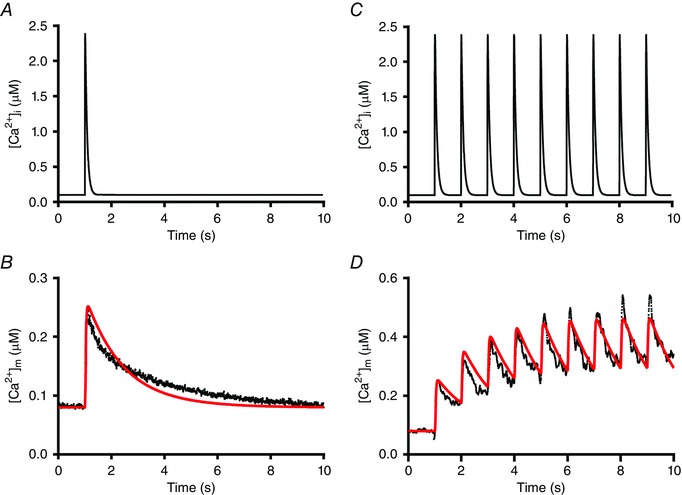
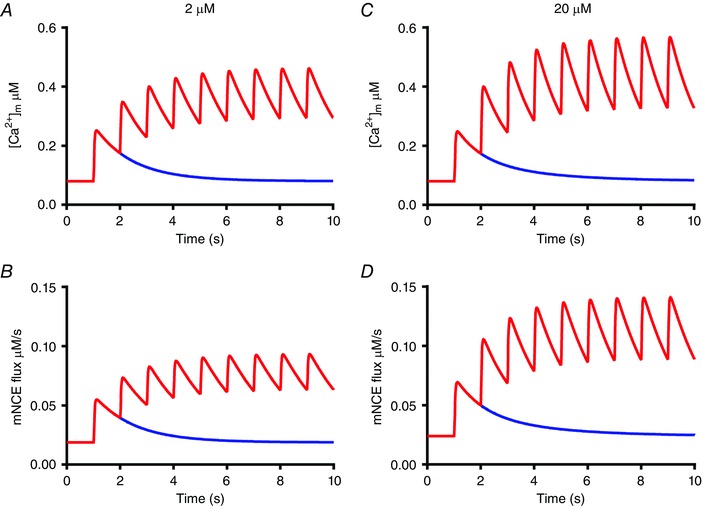
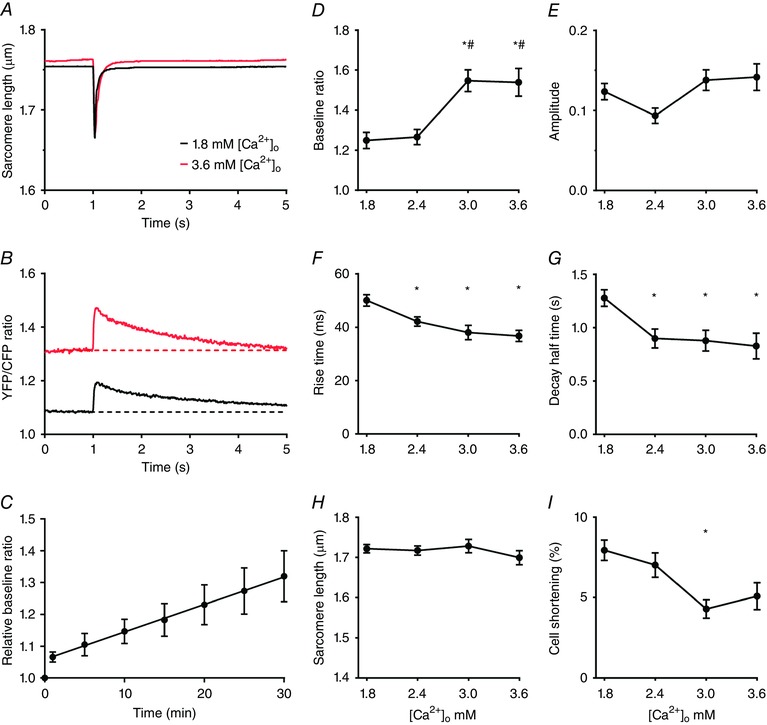
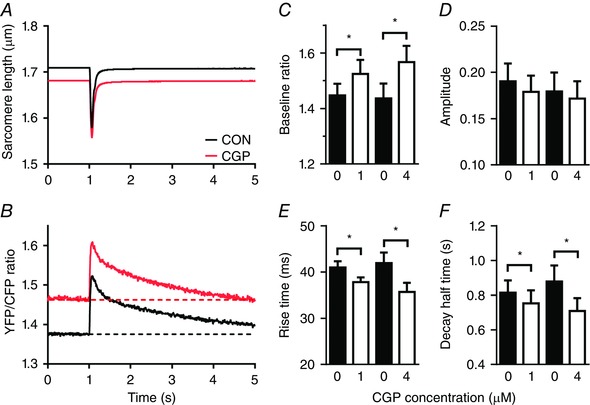
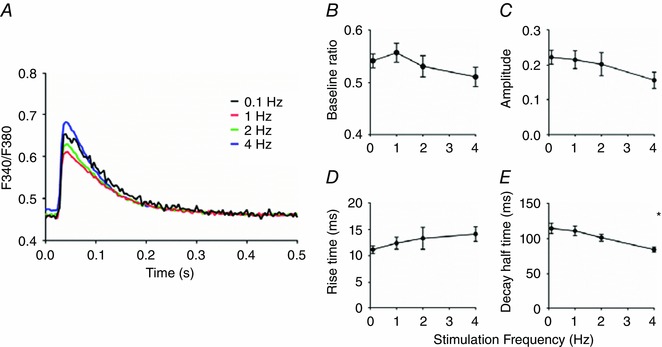
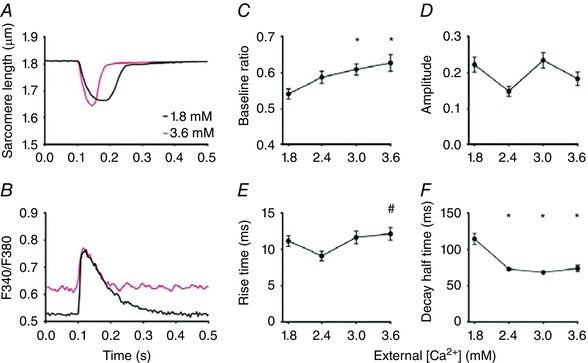
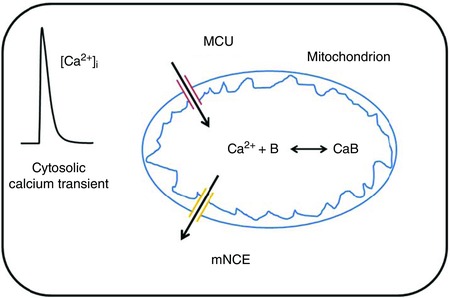
Abstract: Calcium ions regulate mitochondrial ATP production and contractile activity and thus play a pivotal role in matching energy supply and demand in cardiac muscle. Little is known about the magnitude and kinetics of the changes in free mitochondrial calcium concentration in cardiomyocytes. Using adenoviral infection, a ratiometric mitochondrially targeted Förster resonance energy transfer (FRET)-based calcium indicator (4mtD3cpv, MitoCam) was expressed in cultured adult rat cardiomyocytes and the free mitochondrial calcium concentration ([Ca2+ ]m ) was measured at different stimulation frequencies (0.1-4 Hz) and external calcium concentrations (1.8-3.6 mm) at 37°C. Cytosolic calcium concentrations were assessed under the same experimental conditions in separate experiments using Fura-4AM. The increases in [Ca2+ ]m during electrical stimulation at 0.1 Hz were rapid (rise time = 49 ± 2 ms), while the decreases in [Ca2+ ]m occurred more slowly (decay half time = 1.17 ± 0.07 s). Model calculations confirmed that this asymmetry caused the rise in [Ca2+ ]m during diastole observed at elevated stimulation frequencies. Inhibition of the mitochondrial sodium-calcium exchanger (mNCE) resulted in a rise in [Ca2+ ]m at baseline and, paradoxically, in an acceleration of Ca2+ release.

In conclusion: rapid increases in [Ca2+ ]m allow for fast adjustment of mitochondrial ATP production to increases in myocardial demand on a beat-to-beat basis and mitochondrial calcium release depends on mNCE activity and mitochondrial calcium buffering.

Keywords: calcium mitochondria; cardiac muscle; cardiomyocyte; muscle energetics.


Figures

Figure 1
Figure 1. MitoCam targeting and temporal relations between sarcomere shortening, free cytosolic calcium concentration and free mitochondrial calcium concentration
A and B, MitoCam expression (excitation: 495 nm/emission: 535 nm, in green) and MitoTracker Red staining (excitation: 585 nm/emission: 645 nm, in red) in a rat cardiomyocyte (scale bar: 10 μm). C and D, a stack of images in the vertical direction in the area indicated by the rectangle in A and B was used to deconvolve the images shown (scale bar: 3 μm). E, intensity profile in the green and red channel in the rectangle shown in C and D. F–H, sarcomere shortening, free cytosolic calcium (Fura‐4 ratio) and free mitochondrial Ca2+ concentration (YFP/CFP ratio) in electrically stimulated cardiac myocytes at low stimulation frequency (0.1 Hz). At t = 1 s the cell is stimulated electrically. The rise time from 10 to 90% of the amplitude of the increase in free mitochondrial Ca2+ concentration (t 10‐90%) is rapid (∼50 ms) whereas the decay occurs more slowly (decay half time, t 50%: ∼1.2 s). Corresponding values for the cytosolic calcium transient are: t 10‐90%: ∼12 ms; t 50%: ∼80 ms. [Color figure can be viewed at wileyonlinelibrary.com]
Figure 2
Figure 2. The ratiometric properties of MitoCam largely eliminate motion artifacts
A and B, averaged sarcomere length recording from a single cardiomyocyte at 0.1 Hz is almost completely abolished in the presence of the mechanical uncoupler cytochalasin D (CD; 40 μm) (absence of CD, black; presence of CD, red). C and D, the corresponding YPF and CFP intensities. E and F, the corresponding YFP/CFP ratios. G, superposition of the YFP/CFP ratios in the absence and presence of CD, indicating that the time courses were very similar. The intensity fluctuations in the YFP and CFP signal indicated by the blue rectangle did not result in a disturbance of the YFP/CFP ratio. The recordings in C–G were low‐pass filtered at 10 Hz. [Color figure can be viewed at wileyonlinelibrary.com]
Figure 3
Figure 3. MitoCam calibration and time‐dependent changes in autofluorescence
A, average results (mean ± SEM, n = 6 cells) of the relative increase in YFP/CFP ratio after correction of background intensity (R) at different Ca2+ concentrations. The relation RR min =(R max R min )[Ca2+]h[Kd]h+[Ca2+]h was fitted to the averaged data points, with R min = 1.32 ± 0.05, R max = 2.43 ± 0.15, Kd = 1.77 ± 0.36 μm and h = 0.60 ± 0.08. The mean YFP/CFP ratio in these experiments in quiescent cardiomyocytes at baseline (in 1.8 mm external calcium) amounted to 1.47 ± 0.04, which corresponded to 79 nm (range: 44–127 nm). B, average results (n = 3) illustrating the changes in autofluorescence in the YFP and CFP channels measured in quiescent cells.
Figure 4
Figure 4. Kinetics of mitochondrial calcium uptake and release depend on stimulation frequency
A–D, consecutive recordings of free mitochondrial calcium concentration (YFP/CFP ratio) obtained from a single cardiomyocyte stimulated at 0.1, 1, 2 and 4 Hz during the periods indicated by the red bars, with 120 s pauses in between, at 1.8 mm external calcium. For illustration purposes, the recordings were smoothed using a 2‐points running average. The insets of the 1, 2 and 4 Hz recordings show averaged recordings of the quasi‐steady state reached during the final phase of the stimulation period (indicated by the blue rectangles). It can be seen that the free mitochondrial calcium concentration changes on a beat‐to‐beat basis. E, averaged mitochondrial calcium transient derived from the responses obtained at 0.1 Hz shown in A. The inset illustrates the determination of the 10–90% rise time (t 10‐90%). The stimulus pulse occurred at t = 1 s. F–J, overview of the stimulation frequency dependence of [Ca2+]m. K, stimulation frequency dependence of relative cell shortening derived from the changes in sarcomere length. The average values (mean ± SEM) at 0.1, 1, 2 and 4 Hz were obtained from 16, 16, 13 and 9 different cells, respectively. * P < 0.05 vs. 0.1 Hz; # P < 0.05 vs. 1 Hz (one‐way ANOVA). [Color figure can be viewed at wileyonlinelibrary.com]
Figure 5
Figure 5. Asymmetric calcium uptake and release causes frequency‐dependent mitochondrial calcium accumulation
A, schematic diagram of the cytosolic calcium transient ([Ca2+]i). B, the mitochondrial calcium transient ([Ca2+]m, in black) obtained – after calibration – from the experimental recording shown in Fig. 2 E and the simulated mitochondrial calcium transient (in red). C, schematic diagram of the cytosolic calcium transient ([Ca2+]i) at 1 Hz. D, simulation (in red) of the early part of the mitochondrial calcium transient at 1 Hz (in black, derived from the recording shown in Fig. 2 B). For clarity, the averaged experimental recording obtained after calibration at 0.1 Hz was smoothed using a 5‐points running average and the calcium transient at 1 Hz was digitally filtered at 5 Hz. Details on the model and the parameter values used are given in the Appendix. [Color figure can be viewed at wileyonlinelibrary.com]
Figure 6
Figure 6. Model calculations of changes in free mitochondrial calcium concentration and calcium flux via the mNCE
A and B, mitochondrial calcium transient (top) and calcium flux via the mNCE using the parameter values shown in Table 2, i.e. with a total mitochondrial calcium buffer concentration (B tot) of 2 μm. C and D, corresponding graphs at B tot = 20 μm. The multiplication factors f MCU and f mNCE were increased to 3.5 × 10−6 and 3.45, respectively, in order to mimic the amplitude and time course of the mitochondrial calcium transient to a single stimulus at t = 1 s (in blue) shown in A. Note that as a result of a 10‐fold increase in B tot, the amplitude and the maximum value of the mitochondrial calcium transient and of the calcium flux via the mNCE reached at 1 Hz stimulation are increased. [Color figure can be viewed at wileyonlinelibrary.com]
Figure 7
Figure 7. Mitochondrial free calcium at baseline and the speed of mitochondrial calcium uptake and release depend on external calcium concentration
A and B, averaged recordings of sarcomere length and free mitochondrial calcium concentration (YFP/CFP ratio) from a single cardiomyocyte stimulated at 0.1 Hz at 1.8 and 3.6 mm external calcium ([Ca2+]o). The free mitochondrial calcium concentrations at baseline at 3.0 and 3.6 mm were significantly larger than at 1.8 mm. C, the rise in free mitochondrial calcium concentration upon an abrupt change in [Ca2+]o from 1.8 to 3.6 mm was time dependent (n = 4; all mean values P < 0.05 vs. t = 0 s; slope significantly larger than 0, P = 0.0001). D–G, overview of the [Ca2+]o dependence of the [Ca2+]m transient at 0.1 Hz. H and I, [Ca2+]o dependence of sarcomere length and relative cell shortening. The average values (mean ± SEM) at 1.8, 2.4, 3.0 and 3.6 mm in D–I were obtained from 50, 32, 16 and 15 different cells, respectively. * P < 0.05 vs. 1.8 mm [Ca2+]o; # P < 0.05 vs. 2.4 mm [Ca2+]o (one‐way ANOVA). [Color figure can be viewed at wileyonlinelibrary.com]
Figure 8
Figure 8. Inhibition of the mitochondrial mNCE by CGP‐37157 results in an increase in the mitochondrial free calcium concentration at baseline and an increase in speed of mitochondrial calcium uptake and release
A and B, averaged sarcomere length recording and mitochondrial calcium transient from a single cardiomyocyte at 0.1 Hz in the absence (CON, black) and presence of 4 μm CGP‐37157 (CGP) (red). C, the free mitochondrial calcium concentration at baseline increased significantly relative to control (0 CGP) both at 1 and 4 μm CGP. D, the amplitude of the mitochondrial calcium transient remained unaltered both at 1 and 4 μm CGP. E and F, the rise time and the half time of the decay of the mitochondrial calcium transient at 0.1 Hz decreased significantly both at 1 and 4 μm CGP relative to control. The average values (mean ± SEM) at 0 and 1 μm CGP (n = 24) and at 0 and 4 μm CGP (n = 18) were obtained from paired observations. * P < 0.05 vs. 0 μm CGP (Student's t test). [Color figure can be viewed at wileyonlinelibrary.com]
Figure 9
Figure 9. Cytosolic calcium transients at different stimulation frequencies
A, averaged cytosolic calcium transients (F340/F380 ratio) obtained at stimulation frequencies of 0.1, 1, 2 and 4 Hz at 1.8 mm external calcium. B–D, no significant differences were observed in baseline, amplitude or rise time of the calcium transients. E, the decay half time was significantly lower at 4 Hz compared to 0.1 Hz. The average values (mean ± SEM) at 0.1, 1, 2 and 4 Hz were obtained from 20, 21, 13 and 10 different cells, respectively. * P < 0.05 vs. 0.1 Hz (one‐way ANOVA). [Color figure can be viewed at wileyonlinelibrary.com]
Figure 10
Figure 10. Cytosolic calcium transients at different [Ca2+]o
A and B, averaged recordings of sarcomere length and free cytosolic calcium concentration (F340/F380 ratio) from a single cardiomyocyte stimulated at 0.1 Hz at 1.8 and 3.6 mm external calcium ([Ca2+]o). The free cytosolic calcium concentrations at baseline at 3.0 and 3.6 mm were significantly larger than at 1.8 mm. C–F, overview of the [Ca2+]o dependence of the cytosolic calcium transient at 0.1 Hz. The average values (mean ± SEM) at 1.8, 2.4, 3.0 and 3.6 mm in C–F were obtained from 19, 21, 21 and 24 different cells, respectively. * P < 0.05 vs. 1.8 mm [Ca2+]o; # P < 0.05 vs. 2.4 mm [Ca2+]o (one‐way ANOVA). [Color figure can be viewed at wileyonlinelibrary.com]
Figure A1
Figure A1. Schematic diagram of mitochondrial calcium handling used in the simulations
[Color figure can be viewed at wileyonlinelibrary.com]

Similar articles

Cited by

References

    1. Andrienko TN, Picht E, Bers DM (2009). Mitochondrial free calcium regulation during sarcoplasmic reticulum calcium release in rat cardiac myocytes. J Mol Cell Cardiol 46, 1027–1036. - PMC - PubMed
    1. Barth E, Stämmler G, Speiser B & Schaper J (1992). Ultrastructural quantitation of mitochondria and myofilaments in cardiac muscle from 10 different animal species including man. J Mol Cell Cardiol 24, 669–681. - PubMed
    1. Bernardi P (2013). The mitochondrial permeability transition pore: a mystery solved? Front Physiol 4, 95. - PMC - PubMed
    1. Bers DM (2002). Cardiac excitation‐contraction coupling. Nature 415, 198–205. - PubMed
    1. Bovo E, Martin JL, Tyryfter J, de Tombe PP & Zima AV (2016). R‐CEPIA1er as a new tool to directly measure sarcoplasmic reticulum [Ca] in ventricular myocytes. Am J Physiol Heart Circ Physiol 311, H268–H275. - PMC - PubMed

Publication types

LinkOut - more resources